Loganville: Fire Incidents, Pennsylvania (PA)
Where are fire incidents reported in Loganville, PA
Something went wrong! Please refresh the page.
|
| |||||||||||||||||||||||||||||||||||||||||||||||||||||||||||||||||||||||||||||||||||||||||||||||||||||||||||||
2002 - 2018 National Fire Incident Reporting System (NFIRS) incidents
- Incident types reported to NFIRS in Loganville, PA
- 28735.1%Hazardous Condition
- 28534.9%Fire
- 9711.9%Rescue & EMS
- 688.3%Good Intent Call
- 526.4%Service Call
- 253.1%False Alarm
- 30.4%Severe Weather
- Fire incident types reported to NFIRS in Loganville, PA
- 9232.3%Outside Fires
- 8429.5%Structure Fires
- 8329.1%Mobile Property/Vehicle Fires
- 269.1%Other
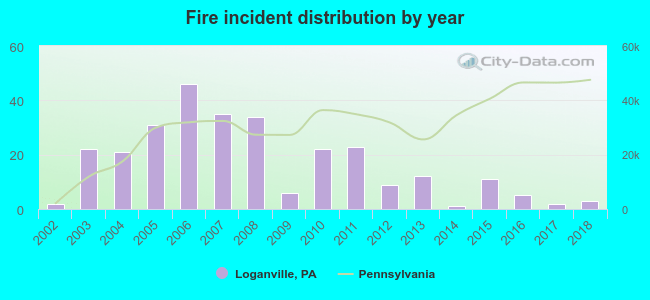 According to the data from the years 2002 - 2018 the average number of fire incidents per year is 17. The highest number of reported fires - 46 took place in 2006, and the least - 1 in 2014. The data has a rising trend.
 33.7% incidents where reported in the morning and 66.3% in the evening. The most fires (18.2%) took place on Wednesday, and the least (10.9%) on Thursday.
 According to the 285 incident reports from years 2002 - 2018 most fires (13.0%) took place during January, and the least (2.8%) in August.
 Out of all 817 cases reported during the years 2002 - 2018, the most belonged to the categories: Rescue & EMS (35.1%), Fire (34.9%), and Overpressure Rupture (11.9%).
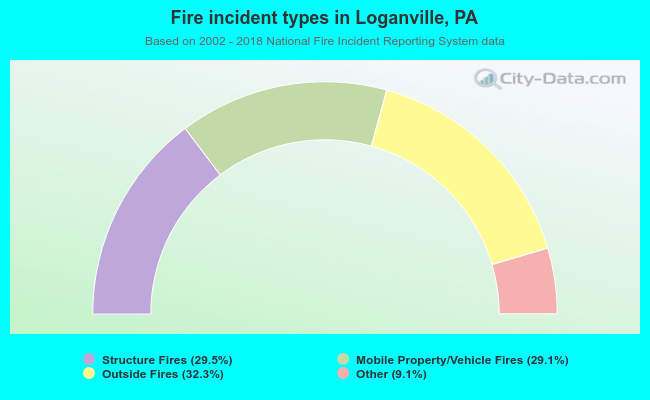 When looking into fire subcategories, the most incidents belonged to: Outside Fires (32.3%), and Structure Fires (29.5%).