| Fire incidents reported |
|---|
| Sreet name | Count |
|---|
| 281 HWY | 52 | | 281 | 40 | | FM 1017 | 20 | | CHAPA RD | 8 | | HWY 281 | 8 | | US HWY 281 | 8 | | BRUSHLINE RD | 6 | | GALVAN RESIDENCE | 6 | | 281 EXPY | 4 | | CHAPA & BRUSHLINE RD | 4 | | FM 3250 | 4 | | FM 3250 & FM 1017 | 4 | | FM 490 | 4 | | LOS VENADOS | 4 | | PUERTO RICO RD | 4 | | US HWY 281 HWY | 4 | | RD | 2 | | !86 & HWY 281 | 2 | | 1 1/2 M ON BRUSHLINE & FM 186 | 2 | | 1/2 M N. EL RUCIO RD | 2 | | 1/2 MI S OF FM 490 ON BRUSHLIN | 2 | | 1/2 MILE N OF FLORAL ON 3250 | 2 | | 1017 | 2 | | 1017 BY STARR CO LINE | 2 | | 1017 FROM HWY 281 | 2 |
| | | Fire incidents reported |
|---|
| Sreet name | Count |
|---|
| 17605 EST. FM RD 490 | 2 | | 186 | 2 | | 186 EAST 3/4 M FROM 281 | 2 | | 186 HWY | 2 | | 2 MI S OF FIRESTATION | 2 | | 22118 LANE RD | 2 | | 3 M E OF HWY 281 ON CHAPA RD | 2 | | 3250 | 2 | | 32515 N EXPWY 281 EXPY | 2 | | 34961 | 2 | | 35128 AGGIE DR. | 2 | | 36478 N. HWY 281 | 2 | | 39TH 1/2 ST | 2 | | 4 M N. OF FM 1017 | 2 | | 4 M. N. OF FM 1017 | 2 | | 490 & BRUSHLINE RD | 2 | | 5 M N 281 | 2 | | 681 | 2 | | 755 | 2 | | 8 M W OF FM 755 ON FM 1017 | 2 | | BB LINE NURSERY RD | 2 | | BRUSHLINE & CHAPA RD | 2 | | BRUSHLINE & FM 186 | 2 | | BRUSHLINE RD & RIO BEEF RD | 2 | | |
|
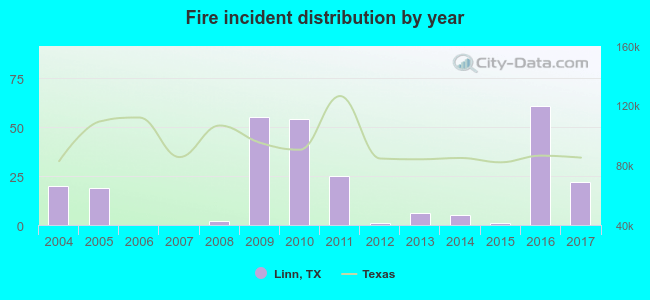 According to the data from the years 2004 - 2017 the average number of fire incidents per year is 19. The highest number of reported fires - 61 took place in 2016, and the least - 0 in 2006. The data has a growing trend.
 24.4% incidents where reported in the morning and 75.6% in the evening. The most fires (16.6%) took place on Saturday, and the least (11.8%) on Wednesday.
 Based on the 271 fire incidents from years 2004 - 2017 most fires (18.1%) took place during January, and the least (4.8%) in June.
 Out of all 524 cases reported during the years 2004 - 2017, the most belonged to the categories: Fire (51.7%), Overpressure Rupture (21.9%), and Rescue & EMS (14.9%).
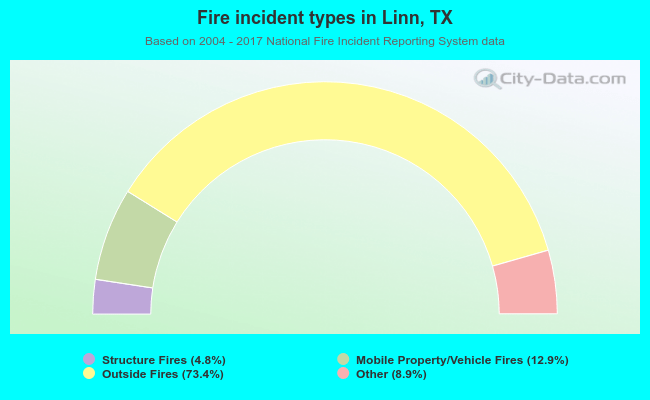 When looking into fire subcategories, the most incidents belonged to: Outside Fires (73.4%), and Mobile Property/Vehicle Fires (12.9%).