Linden: Fire Incidents, Texas (TX)
Where are fire incidents reported in Linden, TX
Something went wrong! Please refresh the page.
|
| |||||||||||||||||||||||||||||||||||||||||||||||||||||||||||||||||||||||||||||||||||||||||||||||||||||||||||||
| Other | 37 | |||||||||||||||||||||||||||||||||||||||||||||||||||||||||||||||||||||||||||||||||||||||||||||||||||||||||||||
2002 - 2017 National Fire Incident Reporting System (NFIRS) incidents
- Incident types reported to NFIRS in Linden, TX
- 30381.7%Fire
- 328.6%Hazardous Condition
- 215.7%Good Intent Call
- 102.7%Rescue & EMS
- 20.5%Service Call
- 20.5%Special Incident
- 10.3%False Alarm
- Fire incident types reported to NFIRS in Linden, TX
- 17056.1%Outside Fires
- 10735.3%Structure Fires
- 185.9%Mobile Property/Vehicle Fires
- 82.6%Other
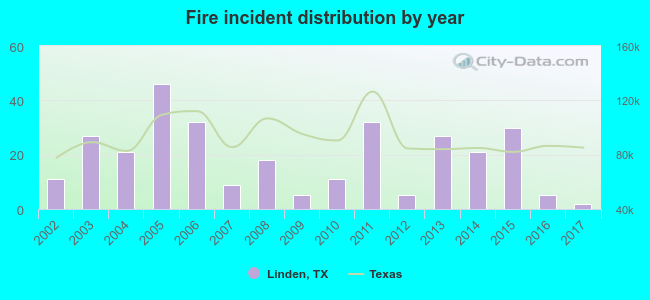 According to the data from the years 2002 - 2017 the average number of fire incidents per year is 19. The highest number of reported fires - 46 took place in 2005, and the least - 2 in 2017. The data has a dropping trend.
 25.1% incidents where reported in the morning and 74.9% in the evening. The most fires (17.2%) took place on Saturday, and the least (11.2%) on Sunday.
 Based on the 303 fire incidents from years 2002 - 2017 most fires (13.5%) took place during February, and the least (3.6%) in June.
 Out of all 371 cases reported during the years 2002 - 2017, the most belonged to the categories: Fire (81.7%), Rescue & EMS (8.6%), and Service Call (5.7%).
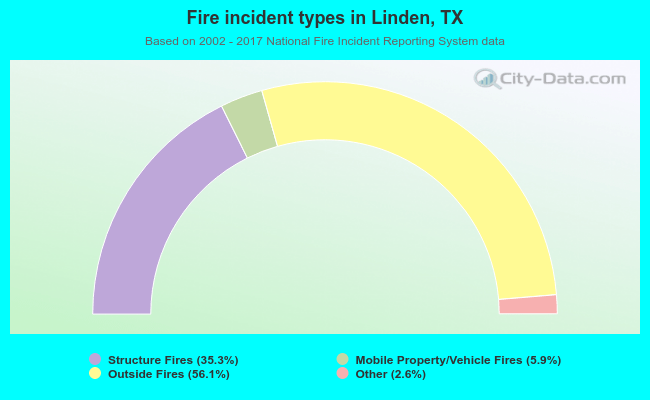 When looking into fire subcategories, the most incidents belonged to: Outside Fires (56.1%), and Structure Fires (35.3%).