Lavaca: Fire Incidents, Arkansas (AR)
Where are fire incidents reported in Lavaca, AR
Something went wrong! Please refresh the page.
|
| |||||||||||||||||||||||||||||||||||||||||||||||||||||||||||||||||||||||||||||||||||||||||||||||||||||||||||||
| Other | 425 | |||||||||||||||||||||||||||||||||||||||||||||||||||||||||||||||||||||||||||||||||||||||||||||||||||||||||||||
2002 - 2018 National Fire Incident Reporting System (NFIRS) incidents
- Incident types reported to NFIRS in Lavaca, AR
- 85547.1%Rescue & EMS
- 68737.8%Fire
- 995.4%Hazardous Condition
- 985.4%Good Intent Call
- 261.4%False Alarm
- 241.3%Service Call
- 241.3%Severe Weather
- 40.2%Special Incident
- Fire incident types reported to NFIRS in Lavaca, AR
- 46067.0%Outside Fires
- 16724.3%Structure Fires
- 497.1%Mobile Property/Vehicle Fires
- 111.6%Other
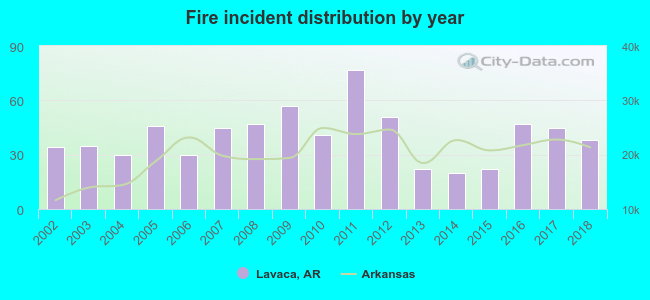 According to the data from the years 2002 - 2018 the average number of fires per year is 40. The highest number of reported fire incidents - 77 took place in 2011, and the least - 20 in 2014. The data has a rising trend.
 The median response time based on all reported fire incidents is 6 minutes. This is comparable to the Arkansas median value.
The median response time in Lavaca, AR compared to nearest cities:
(Note: Based on data for all years, including only cities with at least 500 fire incidents)
| Lavaca: | 6 minutes |
| Charleston: | 8 minutes |
| Greenwood: | 8 minutes |
| Alma: | 8 minutes |
| Van Buren: | 5 minutes |
| Fort Smith: | 3 minutes |
| Mulberry: | 9 minutes |
| Mansfield: | 9 minutes |
| Booneville: | 12 minutes |
 20.5% incidents where reported in the morning and 79.5% in the evening. The most fires (16.7%) took place on Thursday, and the least (11.5%) on Wednesday.
 Based on the 687 reports from years 2002 - 2018 most fires (15.0%) took place during January, and the least (2.3%) in May.
 Out of all 1,817 cases reported during the years 2002 - 2018, the most belonged to the categories: Overpressure Rupture (47.1%), Fire (37.8%), and Rescue & EMS (5.4%).
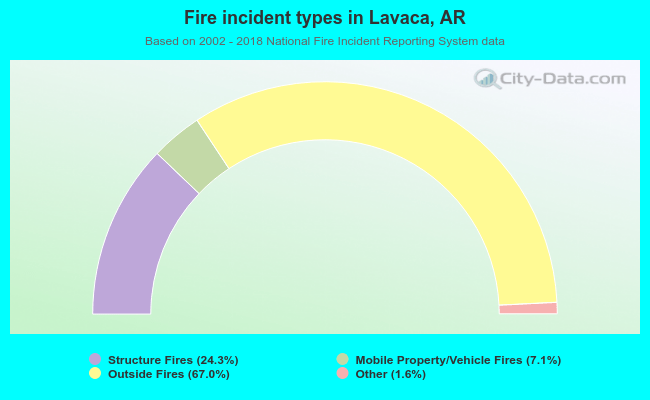 When looking into fire subcategories, the most incidents belonged to: Outside Fires (67.0%), and Structure Fires (24.3%).