| Fire incidents reported |
|---|
| Sreet name | Count |
|---|
| GREENE 508 | 8 | | HWY 135 | 8 | | 507 RD | 6 | | 507 RD | 6 | | GREENE 508 RD | 6 | | 39 GREENE 154 ROAD | 4 | | EAGLE STREET | 4 | | GREENE 140 RD | 4 | | GREENE 503 RD | 4 | | GREENE 507 | 4 | | HIGHWAY 135 | 4 | | RAINBOW DR | 4 | | 11273 HWY 141 N | 2 | | 115 S MAPLE ST | 2 | | 117 GREENE 1250 RD | 2 | | 119 GREENE 613 RD | 2 | | 1298 GREENE 125 ROAD | 2 | | 131 GREENE ROAD | 2 | | 1344 GREENE 503 RD | 2 | | 135 N AND 133RD | 2 | | 135 NORTH HWY | 2 | | 14 MILE FROM 138131 INTERSEC | 2 | | 140 AND 138 RD | 2 | | 141 HWY | 2 | | 141 NORTH | 2 |
| | | Fire incidents reported |
|---|
| Sreet name | Count |
|---|
| 141 SOUTH | 2 | | 142 RD | 2 | | 143 HWY 135 NORTH | 2 | | 143 ROAD | 2 | | 150 GREENE 143 RD | 2 | | 15151 HWY 135 N | 2 | | 15943 HWY 141 | 2 | | 163 N MAPLE ST | 2 | | 1637 GREENE 508 ROAD | 2 | | 16665 HWY 141 | 2 | | 183 MAIN ST | 2 | | 186 RAINBOW DRIVE | 2 | | 1887 HWY 141 | 2 | | 1889 GREENE 441RD | 2 | | 1999 GREENE 502 ROAD | 2 | | 200 GREENE 512 RD | 2 | | 20017 HWY 141 NORTH | 2 | | 2065 GREENE 402 ROAD | 2 | | 2121 GREENE 441 RD | 2 | | 2185 GREENE 138 RD | 2 | | 2288 GREENE 516 RD | 2 | | 282 S MAPLE | 2 | | 282 SOUTH MAPLE | 2 | | 282 SOUTH MAPLE ST | 2 | | 300 S MAPLE ST | 2 |
|
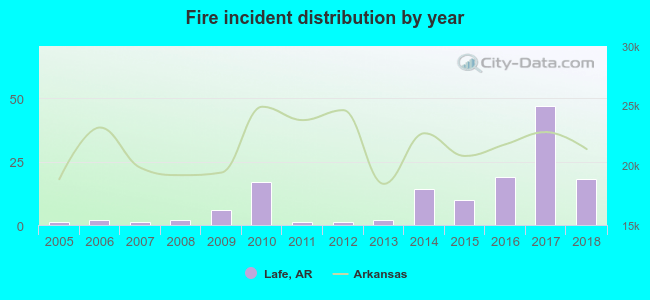 Based on the data from the years 2005 - 2018 the average number of fires per year is 10. The highest number of fire incidents - 47 took place in 2017, and the least - 1 in 2005. The data has a rising trend.
 31.9% incidents where reported in the morning and 68.1% in the evening. The most fires (22.7%) took place on Thursday, and the least (9.2%) on Friday.
 Based on the 141 reports from years 2005 - 2018 most fires (17.0%) took place during November, and the least (2.1%) in July.
 Out of all 196 cases reported during the years 2005 - 2018, the most belonged to the categories: Fire (71.9%), Hazardous Condition (11.7%), and Overpressure Rupture (6.1%).
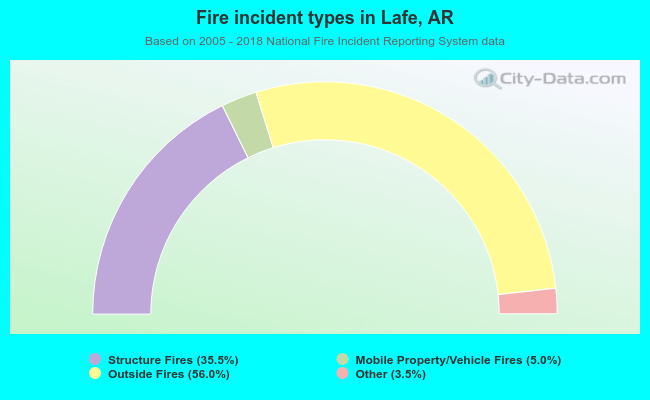 When looking into fire subcategories, the most reports belonged to: Outside Fires (56.0%), and Structure Fires (35.5%).