| Fire incidents reported |
|---|
| Sreet name | Count |
|---|
| I 24 | 26 | | MAIN STREET | 26 | | KIMBALL CROSSING | 12 | | INDUSTRIAL BLVD | 8 | | KIMBALL CROSSING DRIVE | 8 | | I24 | 6 | | JUDY DRIVE | 6 | | WATERFRONT PLACE | 6 | | 1523 BARKER AVE | 4 | | 1523 BARKER AVENUE | 4 | | 280 RED BUD TRAIL | 4 | | HWY 72 | 4 | | INDUSTRIAL BLVD | 4 | | KIMBALL COVE ROAD | 4 | | MAIN ST | 4 | | MEMORY LANE | 4 | | 1354 MAIN STREET | 2 | | 141 HAGGARD LANE | 2 | | 152 MM WEST I-24 | 2 | | 153 M/M EAST BOUND I-24 | 2 | | 154 E I24 | 2 | | 160 MAIN ST | 2 | | 160 MAIN STREET | 2 | | 1633 MAIN STREET | 2 | | 18 KIMBALL LANE | 2 |
| | | Fire incidents reported |
|---|
| Sreet name | Count |
|---|
| 200 BLOCK PONDEROSA DR | 2 | | 205 E MAIN STREET | 2 | | 2180 INDUSTRIAL BLVD | 2 | | 27 TATE ROAD | 2 | | 280 MISTY MEADOWS DRIVE | 2 | | 315 PONDEROSA DRIVE | 2 | | 342 KIMBALL CROSSING DRIVE | 2 | | 37 WALNUT STREET | 2 | | 38 KIMBALL COVE ROAD | 2 | | 385 KIMBALL CROSSING DRIVE | 2 | | 395 MAIN STREET | 2 | | 5 EXECUTIVE DRIVE | 2 | | 50 KIMBALL COVE ROAD | 2 | | 51 KIMBALL LANE | 2 | | 525 KIMBALL CROSSING DRIVE | 2 | | 550 KIMBALL CROSSIN DR | 2 | | 610 REDBUD TRAIL | 2 | | 967 MAIN STREET LOT 37 | 2 | | BATTLECREEK RD | 2 | | BROWN ROAD | 2 | | EAST BOUND I-24 EXIT 154 | 2 | | EXIT 152 ON RAMP | 2 | | HILLCREST LANE | 2 | | HILLCREST LN | 2 | | HWY 2 & HWY 72 | 2 |
|
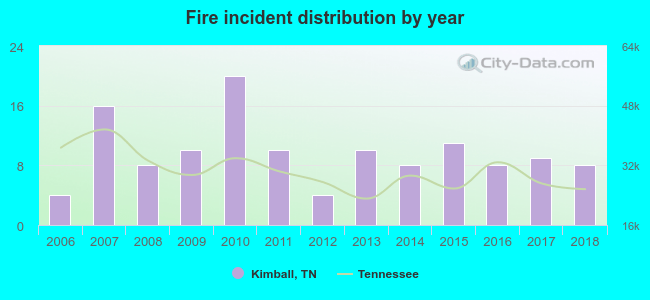 According to the data from the years 2006 - 2018 the average number of fires per year is 10. The highest number of reported fires - 20 took place in 2010, and the least - 4 in 2006. The data has a rising trend.
 33.3% incidents where reported in the morning and 66.7% in the evening. The most fires (20.6%) took place on Thursday, and the least (7.9%) on Tuesday.
 According to the 126 incident reports from years 2006 - 2018 most fires (12.7%) took place during March, and the least (4.0%) in November.
 Out of all 254 cases reported during the years 2006 - 2018, the most belonged to the categories: Fire (49.6%), Rescue & EMS (29.5%), and Service Call (8.7%).
 When looking into fire subcategories, the most reports belonged to: Mobile Property/Vehicle Fires (39.7%), and Outside Fires (28.6%).