Kahului: Fire Incidents, Hawaii (HI)
Where are fire incidents reported in Kahului, HI
Something went wrong! Please refresh the page.
| Fire incidents reported | |
|---|---|
| Sreet name | Count |
| MOKULELE HWY | 158 |
| PULEHU RD | 156 |
| KAAHUMANU AVE | 122 |
| HALEAKALA HWY | 82 |
| KAHULUI BEACH RD | 80 |
| PUUNENE AVE | 78 |
| LONO AVE | 74 |
| PAPA AVE | 74 |
| DAIRY RD | 68 |
| KUIHELANI HWY | 68 |
| HANA HWY | 66 |
| KAMEHAMEHA AVE | 66 |
| AMALA PL | 54 |
| HINA AVE | 50 |
| WAIKO RD | 44 |
| WAKEA AVE | 44 |
| HALEAKALA HWY | 42 |
| PAKAULA ST | 42 |
| HANA HWY | 40 |
| HANSEN RD | 32 |
| KANALOA AVE | 32 |
| MOLOKAI HEMA ST | 28 |
| UHU ST | 28 |
| ALAHAO ST | 24 |
| MOKULELE HWY | 24 |
| ALAMAHA ST | 22 |
| KALA RD | 22 |
| ONEHEE AVE | 22 |
| HAWAII ST | 20 |
| KANE ST | 20 |
2002 - 2018 National Fire Incident Reporting System (NFIRS) incidents
- Incident types reported to NFIRS in Kahului, HI
- 3,67045.7%Rescue & EMS
- 1,49118.6%Good Intent Call
- 1,40217.5%Fire
- 6478.1%Hazardous Condition
- 4816.0%False Alarm
- 3244.0%Service Call
- 90.1%Severe Weather
- Fire incident types reported to NFIRS in Kahului, HI
- 81858.3%Outside Fires
- 28820.5%Mobile Property/Vehicle Fires
- 28420.3%Structure Fires
- 120.9%Other
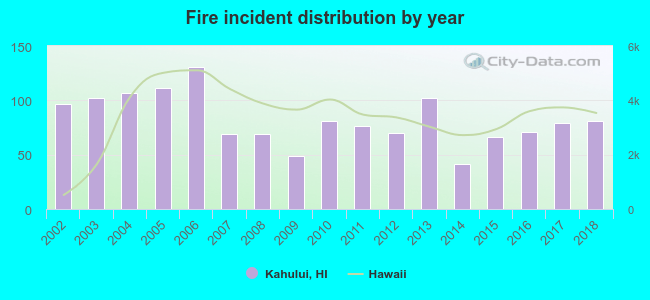 According to the data from the years 2002 - 2018 the average number of fire incidents per year is 82. The highest number of fire incidents - 131 took place in 2006, and the least - 41 in 2014. The data has a decreasing trend.
The average number of yearly fire incidents per 10k residents in Kahului, HI compared to nearest cities:
(Note: Based on data for the last 3 years, including only cities with population 5,000 and above)
| Kahului: | 29.2 |
| Wailuku: | 23.3 |
| Pukalani: | 20.2 |
| Kihei: | 28.1 |
| Makawao: | 20.4 |
| Kula: | 34.5 |
| Lahaina: | 60.1 |
| Waimea: | 11.6 |
| Waimanalo: | 80.7 |
 The median response time based on all reported fire incidents is 6 minutes. This is about the same as the Hawaii median value.
The median response time in Kahului, HI compared to nearest cities:
(Note: Based on data for all years, including only cities with at least 500 fire incidents)
| Kahului: | 6 minutes |
| Wailuku: | 6 minutes |
| Paia: | 6 minutes |
| Kihei: | 6 minutes |
| Lahaina: | 8 minutes |
| Waimanalo: | 7 minutes |
| Kailua: | 6 minutes |
| Honolulu: | 5 minutes |
| Kaneohe: | 6 minutes |
 Based on the reports from the years 2002 - 2018 the average number of fire-related casualties per year is 0. The highest number of reported injuries - 2 took place in 2009, and the lowest - 0 in 2002. The data has a constant trend.
The average number of casualties per 1,000 fires is 6. This indicator was the highest - 41 in 2009, and the lowest 0 in 2002. The trend for casualties per 1,000 fire incidents is dropping. Compared to the state value the number of casualties per 1,000 fire incidents is about the same.
Based on the reports from the years 2002 - 2018 the average number of fire-related casualties per year is 0. The highest number of reported injuries - 2 took place in 2009, and the lowest - 0 in 2002. The data has a constant trend.
The average number of casualties per 1,000 fires is 6. This indicator was the highest - 41 in 2009, and the lowest 0 in 2002. The trend for casualties per 1,000 fire incidents is dropping. Compared to the state value the number of casualties per 1,000 fire incidents is about the same.
 38.2% incidents where reported in the morning and 61.8% in the evening. The most fires (16.5%) took place on Monday, and the least (12.4%) on Thursday.
 According to the 1,402 fires from years 2002 - 2018 most fires (16.0%) took place during July, and the least (5.8%) in March.
 Out of all 8,032 cases reported during the years 2002 - 2018, the most belonged to the categories: Rescue & EMS (45.7%), Good Intent Call (18.6%), and Fire (17.5%).
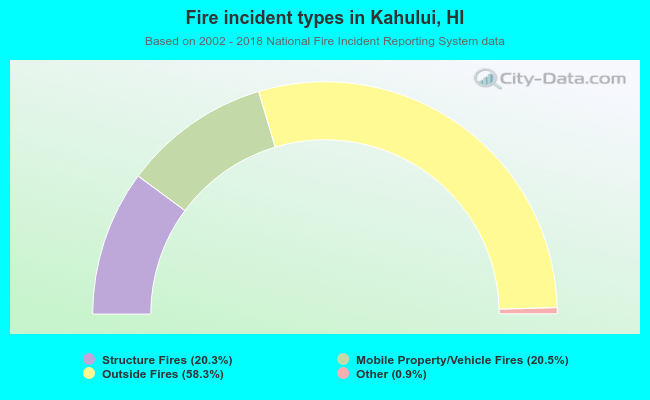 When looking into fire subcategories, the most incidents belonged to: Outside Fires (58.3%), and Mobile Property/Vehicle Fires (20.5%).