Jamestown: Fire Incidents, California (CA)
Where are fire incidents reported in Jamestown, CA
Something went wrong! Please refresh the page.
|
| |||||||||||||||||||||||||||||||||||||||||||||||||||||||||||||||||||||||||||||||||||||||||||||||||||||||||||||
2005 - 2018 National Fire Incident Reporting System (NFIRS) incidents
- Incident types reported to NFIRS in Jamestown, CA
- 89255.7%Rescue & EMS
- 31819.9%Service Call
- 23114.4%Fire
- 563.5%Good Intent Call
- 523.2%Hazardous Condition
- 523.2%False Alarm
- Fire incident types reported to NFIRS in Jamestown, CA
- 12353.2%Outside Fires
- 7030.3%Structure Fires
- 2310.0%Mobile Property/Vehicle Fires
- 156.5%Other
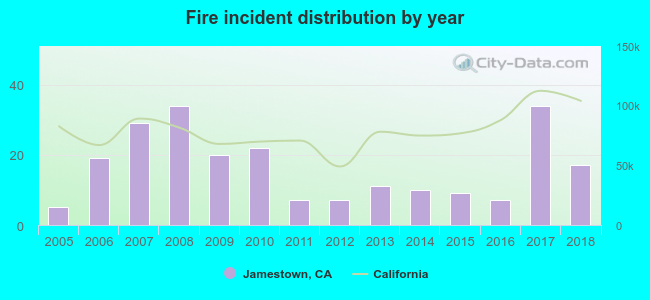 Based on the data from the years 2005 - 2018 the average number of fire incidents per year is 17. The highest number of fires - 34 took place in 2008, and the least - 5 in 2005. The data has a rising trend.
 31.2% incidents where reported in the morning and 68.8% in the evening. The most fires (19.9%) took place on Sunday, and the least (10.0%) on Monday.
 According to the 231 fire incident reports from years 2005 - 2018 most fires (21.2%) took place during July, and the least (3.5%) in April.
 Out of all 1,602 cases reported during the years 2005 - 2018, the most belonged to the categories: Overpressure Rupture (55.7%), Hazardous Condition (19.9%), and Fire (14.4%).
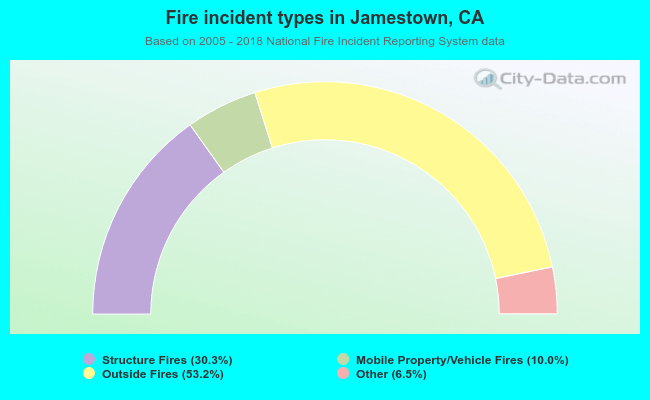 When looking into fire subcategories, the most incidents belonged to: Outside Fires (53.2%), and Structure Fires (30.3%).