Ironwood: Fire Incidents, Michigan (MI)
Where are fire incidents reported in Ironwood, MI
Something went wrong! Please refresh the page.
|
| |||||||||||||||||||||||||||||||||||||||||||||||||||||||||||||||||||||||||||||||||||||||||||||||||||||||||||||
2002 - 2018 National Fire Incident Reporting System (NFIRS) incidents
- Incident types reported to NFIRS in Ironwood, MI
- 43864.6%Fire
- 13519.9%Hazardous Condition
- 639.3%False Alarm
- 172.5%Good Intent Call
- 142.1%Service Call
- 71.0%Overpressure Rupture
- 30.4%Rescue & EMS
- 10.1%Special Incident
- Fire incident types reported to NFIRS in Ironwood, MI
- 21549.1%Structure Fires
- 10223.3%Outside Fires
- 9321.2%Mobile Property/Vehicle Fires
- 286.4%Other
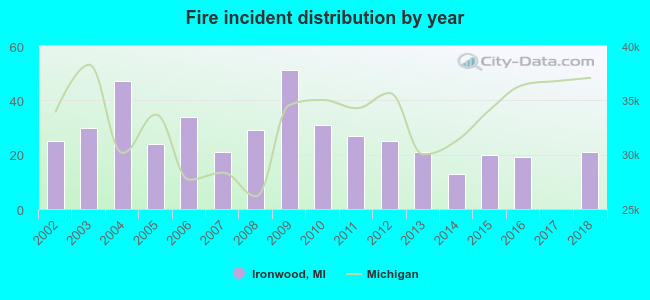 According to the data from the years 2002 - 2018 the average number of fires per year is 26. The highest number of fire incidents - 51 took place in 2009, and the least - 0 in 2017. The data has a decreasing trend.
The average number of yearly fire incidents per 10k residents in Ironwood, MI compared to nearest cities:
(Note: Based on data for the last 3 years, including only cities with population 5,000 and above)
| Ironwood: | 39.1 |

 According to the reports from the years 2002 - 2018 the average number of fire-related fatalities per year is 0. The highest number of reported deaths - 3 took place in 2018, and the lowest - 0 in 2003. The data has an increasing trend.
 According to the reports from the years 2002 - 2018 the average number of fire-related yearly casualties is 1. The highest number of reported injuries - 3 took place in 2002, and the lowest - 0 in 2003. The data has a constant trend.
 33.3% incidents where reported in the morning and 66.7% in the evening. The most fires (16.2%) took place on Tuesday, and the least (12.3%) on Thursday.
 Based on the 438 fire incident reports from years 2002 - 2018 most fires (11.6%) took place during May, and the least (6.6%) in November.
 Out of all 678 cases reported during the years 2002 - 2018, the most belonged to the categories: Fire (64.6%), Hazardous Condition (19.9%), and False Alarm (9.3%).
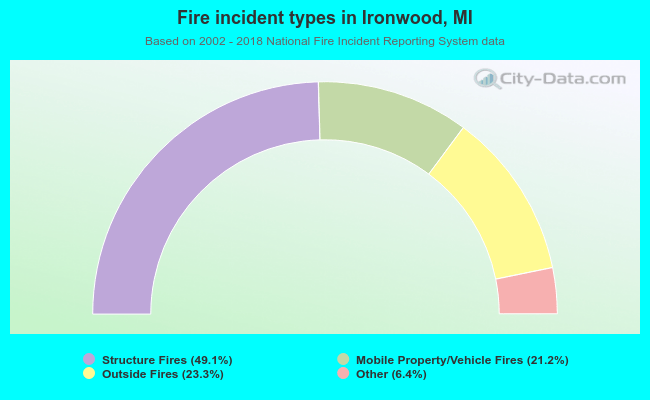 When looking into fire subcategories, the most incidents belonged to: Structure Fires (49.1%), and Outside Fires (23.3%).