| Fire incidents reported |
|---|
| Sreet name | Count |
|---|
| FM 444 | 128 | | HOLLY BROOK DR | 58 | | US HWY 59 N | 40 | | OLD HIGHWAY RD | 38 | | GARCITAS CREEK RD | 28 | | TIPTON RD | 26 | | LIVE OAK DR | 22 | | MIDWAY RD | 20 | | SALEM RD | 20 | | RAGSDALE RD | 18 | | LASALLE RD | 16 | | RODEO RD | 16 | | US HIGHWAY 59 NB | 16 | | US HWY 59 (700390) | 16 | | BENBOW RD | 14 | | US HIGHWAY 59 | 14 | | US HWY 59 NORTH NB (68538 | 14 | | ACORN LOOP | 12 | | GENTRY RD | 12 | | J2 RANCH RD | 12 | | OCELET DR | 12 | | FRANZ RD | 10 | | SALEM (655410) RD | 10 | | BECK E RD | 8 | | GARCITAS GROVE | 8 |
| | | Fire incidents reported |
|---|
| Sreet name | Count |
|---|
| MARRAGGIA RD | 8 | | NICKEL RD | 8 | | OTTO RD | 8 | | TREASURE OAKS RD | 8 | | US HWY 59 (685390) | 8 | | US HWY 59700390 | 8 | | WILSON RD | 8 | | FM 1686 | 6 | | J-2 RANCH RD | 6 | | KARNES RD | 6 | | KEERAN RD | 6 | | POST OAK JCT | 6 | | SALEM (670420) RD | 6 | | BECK RD | 4 | | BISCHOFF RD | 4 | | DODD RD | 4 | | GIN RD | 4 | | GLENWOOD DR | 4 | | HUBALEK RD | 4 | | JENTRY RD | 4 | | LEITA RD | 4 | | POST OAK BLVD | 4 | | RICHTER RD | 4 | | THOMAS LN | 4 | | |
|
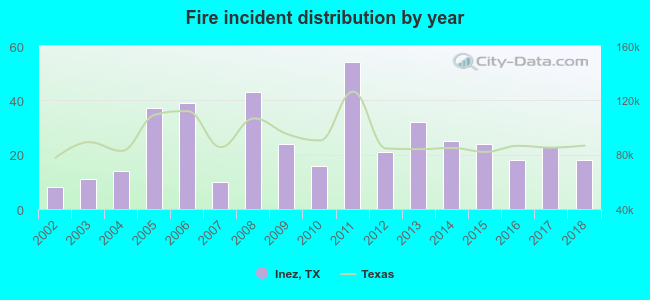 Based on the data from the years 2002 - 2018 the average number of fires per year is 25. The highest number of reported fire incidents - 54 took place in 2011, and the least - 8 in 2002. The data has an increasing trend.
 21.6% incidents where reported in the morning and 78.4% in the evening. The most fires (19.9%) took place on Sunday, and the least (12.0%) on Saturday.
 According to the 417 fire incident reports from years 2002 - 2018 most fires (13.9%) took place during January, and the least (3.8%) in April.
 Out of all 1,344 cases reported during the years 2002 - 2018, the most belonged to the categories: Rescue & EMS (43.0%), Fire (31.0%), and Good Intent Call (17.8%).
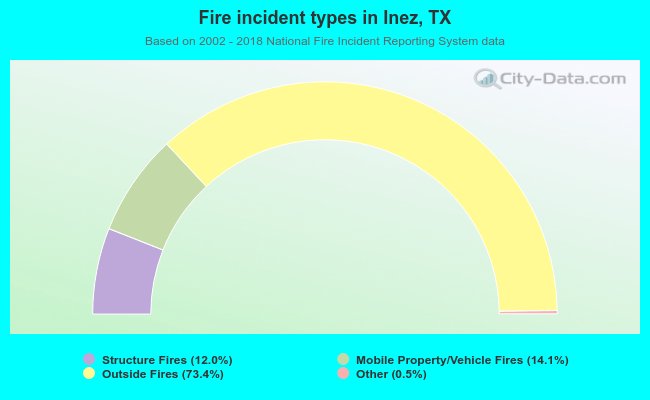 When looking into fire subcategories, the most reports belonged to: Outside Fires (73.4%), and Mobile Property/Vehicle Fires (14.1%).