Hope: Fire Incidents, Indiana (IN)
Where are fire incidents reported in Hope, IN
Something went wrong! Please refresh the page.
|
| |||||||||||||||||||||||||||||||||||||||||||||||||||||||||||||||||||||||||||||||||||||||||||||||||||||||||||||
| Other | 4 | |||||||||||||||||||||||||||||||||||||||||||||||||||||||||||||||||||||||||||||||||||||||||||||||||||||||||||||
2002 - 2017 National Fire Incident Reporting System (NFIRS) incidents
- Incident types reported to NFIRS in Hope, IN
- 44044.4%Fire
- 30230.5%Rescue & EMS
- 13413.5%Hazardous Condition
- 616.2%Good Intent Call
- 303.0%Service Call
- 121.2%False Alarm
- 60.6%Special Incident
- 30.3%Overpressure Rupture
- 30.3%Severe Weather
- Fire incident types reported to NFIRS in Hope, IN
- 17539.8%Structure Fires
- 15835.9%Outside Fires
- 6214.1%Mobile Property/Vehicle Fires
- 4510.2%Other
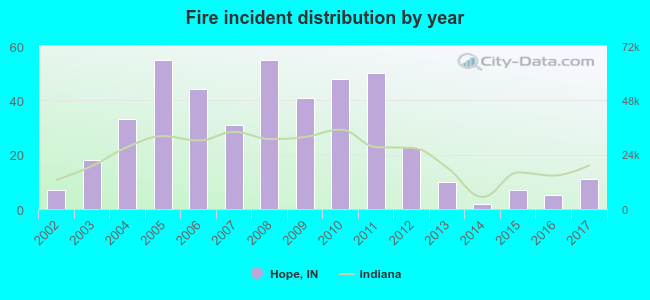 Based on the data from the years 2002 - 2017 the average number of fires per year is 28. The highest number of fire incidents - 55 took place in 2005, and the least - 2 in 2014. The data has an increasing trend.
 35.5% incidents where reported in the morning and 64.5% in the evening. The most fires (18.6%) took place on Friday, and the least (10.9%) on Thursday.
 According to the 440 fires from years 2002 - 2017 most fires (12.7%) took place during October, and the least (5.0%) in August.
 Out of all 991 cases reported during the years 2002 - 2017, the most belonged to the categories: Fire (44.4%), Rescue & EMS (30.5%), and Hazardous Condition (13.5%).
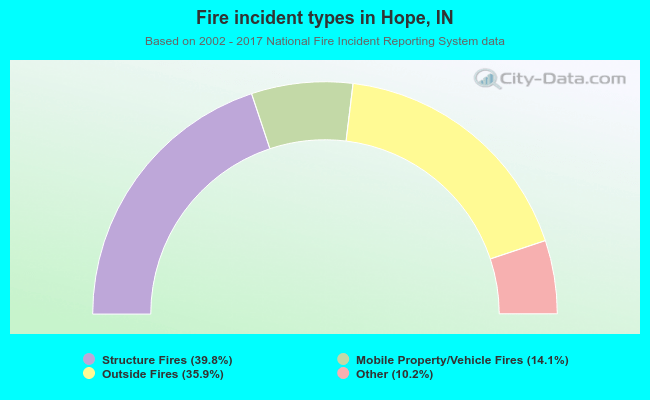 When looking into fire subcategories, the most reports belonged to: Structure Fires (39.8%), and Outside Fires (35.9%).