Hoopeston: Fire Incidents, Illinois (IL)
Where are fire incidents reported in Hoopeston, IL
Something went wrong! Please refresh the page.
|
| |||||||||||||||||||||||||||||||||||||||||||||||||||||||||||||||||||||||||||||||||||||||||||||||||||||||||||||
2003 - 2018 National Fire Incident Reporting System (NFIRS) incidents
- Incident types reported to NFIRS in Hoopeston, IL
- 50743.6%Fire
- 33929.2%Hazardous Condition
- 12510.8%False Alarm
- 867.4%Rescue & EMS
- 554.7%Good Intent Call
- 464.0%Service Call
- 20.2%Overpressure Rupture
- Fire incident types reported to NFIRS in Hoopeston, IL
- 25450.1%Structure Fires
- 19839.1%Outside Fires
- 5310.5%Mobile Property/Vehicle Fires
- 20.4%Other
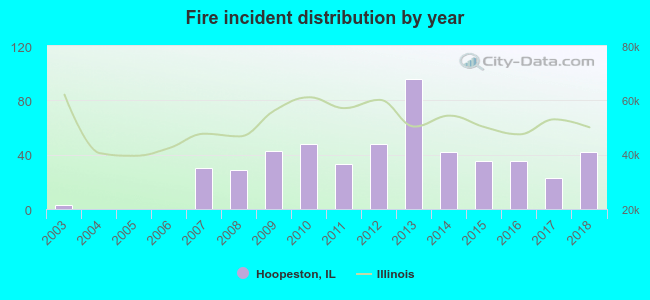 Based on the data from the years 2003 - 2018 the average number of fire incidents per year is 32. The highest number of fire incidents - 96 took place in 2013, and the least - 0 in 2004. The data has a rising trend.
 The median response time based on all reported fire incidents is 5 minutes. This is close to the Illinois median value.
The median response time in Hoopeston, IL compared to nearest cities:
(Note: Based on data for all years, including only cities with at least 500 fire incidents)
| Hoopeston: | 5 minutes |
| Watseka: | 8 minutes |
| Danville: | 5 minutes |
| Rantoul: | 5 minutes |
| Westville: | 10 minutes |
| Georgetown: | 10 minutes |
 33.1% incidents where reported in the morning and 66.9% in the evening. The most fires (16.6%) took place on Sunday, and the least (11.2%) on Tuesday.
 Based on the 507 fire incidents from years 2003 - 2018 most fires (16.0%) took place during June, and the least (6.1%) in September.
 Out of all 1,162 cases reported during the years 2003 - 2018, the most belonged to the categories: Fire (43.6%), Hazardous Condition (29.2%), and False Alarm (10.8%).
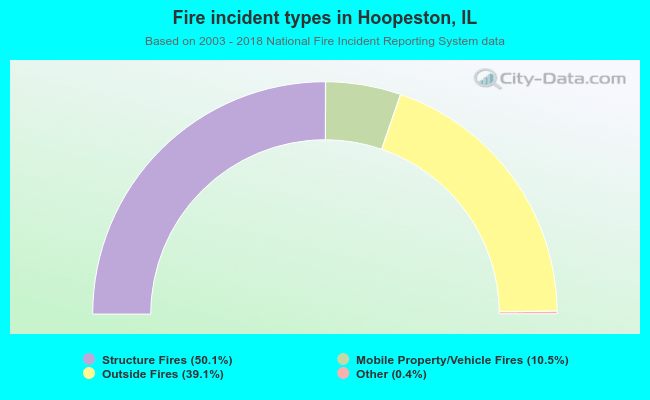 When looking into fire subcategories, the most reports belonged to: Structure Fires (50.1%), and Outside Fires (39.1%).