| Fire incidents reported |
|---|
| Sreet name | Count |
|---|
| ROUTE 175 | 28 | | EAST HOLDERNESS RD | 24 | | ROUTE 3 | 24 | | NORTH RIVER ST | 20 | | ROUTE 175A | 16 | | EAST HOLDERNESS ROAD | 12 | | PINEHURST RD | 12 | | ROUTE 175-A | 12 | | HERITAGE HILL RD | 10 | | MOUNT PROSPECT RD | 10 | | WHITE ASH RD | 10 | | BEEDE RD | 8 | | HERITAGE HILL RD | 8 | | MORIN ST | 8 | | PERCH POND ROAD | 8 | | RANGE RD | 8 | | ROUTE 113 | 8 | | WINNETASKA LN | 8 | | BEEDE RD | 6 | | FIELDHOUSE RD | 6 | | SOUTH RIVER ST | 6 | | SOUTH RIVER STREET | 6 | | CHAPEL LANE | 4 | | CHAPEL LANE | 4 | | COXBORO RD | 4 |
| | | Fire incidents reported |
|---|
| Sreet name | Count |
|---|
| CROMWELL POINT ROAD | 4 | | EAST HOLDERNESS RD | 4 | | LANE RD | 4 | | MOUNT FAYAL RD | 4 | | NH ROUTE 175 | 4 | | NORTH RIVER ST | 4 | | NORTH RIVER ST. | 4 | | OWL BROOK ROAD | 4 | | PERKINS LANE | 4 | | PROSPECT WOODS RD | 4 | | RANGE RD | 4 | | WHITE OAKS RD | 4 | | WINNETASKA LANE | 4 | | WOODS WAY | 4 | | 175 RT | 2 | | AVERY RD | 2 | | AVERY ST | 2 | | BEEDE | 2 | | BLUEBERRY HILL ROAD | 2 | | BUTTONWOOD RD. | 2 | | CHAPEL LN | 2 | | COXBORO RD | 2 | | COXBORO RD. | 2 | | DOLAN ROAD | 2 | | EASY ST | 2 |
|
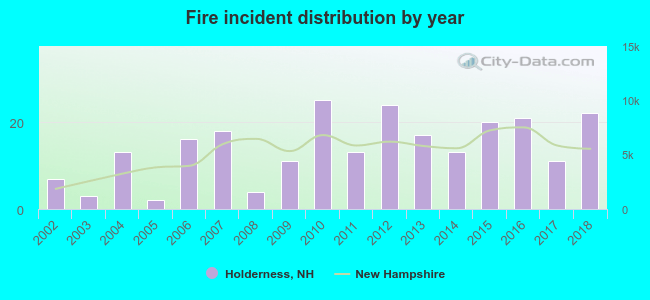 According to the data from the years 2002 - 2018 the average number of fires per year is 14. The highest number of fires - 25 took place in 2010, and the least - 2 in 2005. The data has a rising trend.
 28.8% incidents where reported in the morning and 71.3% in the evening. The most fires (21.7%) took place on Sunday, and the least (9.2%) on Tuesday.
 According to the 240 incident reports from years 2002 - 2018 most fires (15.0%) took place during February, and the least (5.4%) in June.
 Out of all 2,808 cases reported during the years 2002 - 2018, the most belonged to the categories: Rescue & EMS (51.5%), Good Intent Call (12.7%), and False Alarm (12.2%).
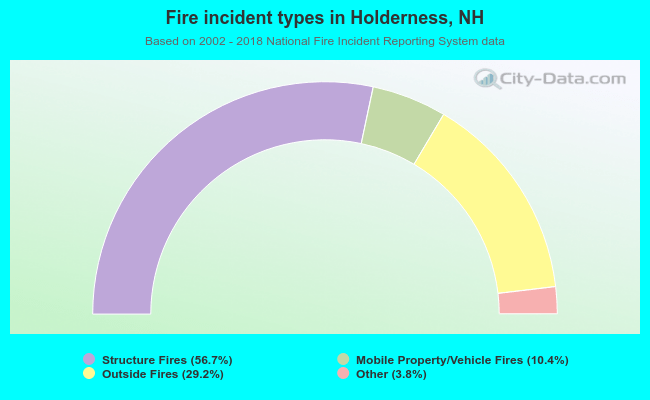 When looking into fire subcategories, the most reports belonged to: Structure Fires (56.7%), and Outside Fires (29.2%).