| Fire incidents reported |
|---|
| Sreet name | Count |
|---|
| T H 103 | 8 | | 12873 CH 77 | 6 | | CH 115 | 6 | | CH 77 | 6 | | COUNTY HWY. 71 | 6 | | 12015 CR 77 (MARSEILLES) | 4 | | CO RD 77 | 4 | | CSX RAILROAD | 4 | | SR 294 | 4 | | TWP RD 103 | 4 | | TWP. HWY. 125 | 4 | | US 23 NORTH BOUND LANE | 4 | | 13780 TH 127 UPPER SANDUY | 2 | | 14543 TWP. HWY. 124 | 2 | | 16009 ST. RT 294 | 2 | | 16020 TH 127 | 2 | | 16633 CH 113 | 2 | | 16993 TH 113 | 2 | | 17305 TH 113 | 2 | | 17353 CH 113 | 2 | | 17444 CHEROKEE ST. | 2 | | 17486 CH 115 | 2 | | 17550 CHEROKEE ST. | 2 | | 17985 CHEROKEE ST. | 2 | | 1800 MARSEILLES/GALION RD | 2 |
| | | Fire incidents reported |
|---|
| Sreet name | Count |
|---|
| 231 SOUTH OF WYANDOT | 2 | | 2970 COUNTY HIGHWAY 74 | 2 | | 3918 ST HWY 294 | 2 | | 5252 ST RT 294 | 2 | | 5376 MADISON ST. | 2 | | 6778 WYANDOT ST | 2 | | 7156 WYANDOT ST. | 2 | | 7191 RAILROAD ST | 2 | | 7223 WYANDOT ST | 2 | | 7254 SHAWNEE ST. | 2 | | 7268 SHAWNEE ST. | 2 | | 7272 WYANDOT ST. | 2 | | 7750 ST. HWY. 294 | 2 | | 7999 SH 294 | 2 | | 9014 SR 265 | 2 | | CH 62 BETWEEN 119 & US 23 | 2 | | CH 71 HWY | 2 | | CH 74 & CH 113 | 2 | | CO HWY 119 | 2 | | CO. HWY 77 | 2 | | CO. RD 68 (MYERS WOODS) | 2 | | CO. RD. 125 (POND 30 ) | 2 | | CO.HWY. 77 | 2 | | COUNTY HIGHWAY 77 HWY | 2 | | |
|
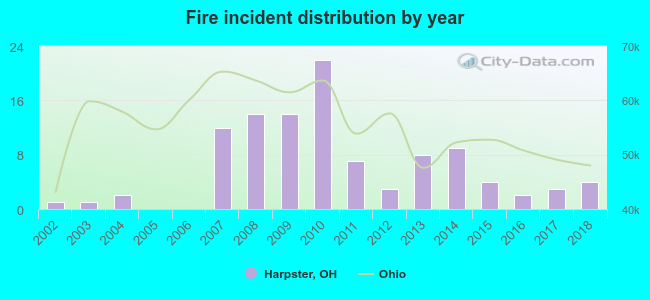 Based on the data from the years 2002 - 2018 the average number of fire incidents per year is 6. The highest number of reported fire incidents - 22 took place in 2010, and the least - 0 in 2005. The data has a growing trend.
 33.0% incidents where reported in the morning and 67.0% in the evening. The most fires (21.7%) took place on Tuesday, and the least (4.7%) on Thursday.
 According to the 106 reports from years 2002 - 2018 most fires (23.6%) took place during March, and the least (0.9%) in June.
 Out of all 194 cases reported during the years 2002 - 2018, the most belonged to the categories: Fire (54.6%), Overpressure Rupture (31.4%), and Rescue & EMS (8.2%).
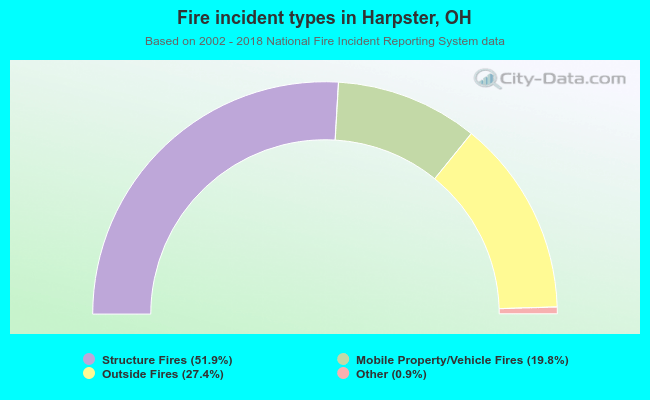 When looking into fire subcategories, the most reports belonged to: Structure Fires (51.9%), and Outside Fires (27.4%).