Halifax: Fire Incidents, Massachusetts (MA)
Where are fire incidents reported in Halifax, MA
Something went wrong! Please refresh the page.
|
| |||||||||||||||||||||||||||||||||||||||||||||||||||||||||||||||||||||||||||||||||||||||||||||||||||||||||||||
2002 - 2018 National Fire Incident Reporting System (NFIRS) incidents
- Incident types reported to NFIRS in Halifax, MA
- 4,22257.8%Rescue & EMS
- 96213.2%Hazardous Condition
- 86811.9%Service Call
- 4966.8%Fire
- 4616.3%False Alarm
- 2353.2%Good Intent Call
- 470.6%Severe Weather
- 130.2%Special Incident
- Fire incident types reported to NFIRS in Halifax, MA
- 25651.6%Structure Fires
- 18336.9%Outside Fires
- 469.3%Mobile Property/Vehicle Fires
- 112.2%Other
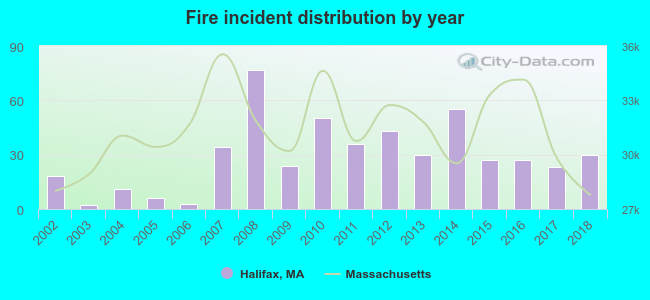 Based on the data from the years 2002 - 2018 the average number of fire incidents per year is 29. The highest number of reported fires - 77 took place in 2008, and the least - 2 in 2003. The data has a growing trend.
The average number of yearly fire incidents per 10k residents in Halifax, MA compared to nearest cities:
(Note: Based on data for the last 3 years, including only cities with population 5,000 and above)
| Halifax: | 35.5 |
| East Bridgewater: | 25.9 |
| Pembroke: | 3.6 |
| Bridgewater: | 125.4 |
| Kingston: | 82.3 |
| Whitman: | 19.8 |
| Middleborough: | 34.8 |
| West Bridgewater: | 57.4 |
| Hanover: | 38.7 |

 Based on the data from the years 2002 - 2018 the average number of fire-related yearly casualties is 1. The highest number of reported injuries - 3 took place in 2014, and the lowest - 0 in 2002. The data has a rising trend.
 28.6% incidents where reported in the morning and 71.4% in the evening. The most fires (16.5%) took place on Wednesday, and the least (12.3%) on Friday.
 According to the 496 fire incident reports from years 2002 - 2018 most fires (13.7%) took place during April, and the least (5.4%) in October.
 Out of all 7,305 cases reported during the years 2002 - 2018, the most belonged to the categories: Rescue & EMS (57.8%), Hazardous Condition (13.2%), and Service Call (11.9%).
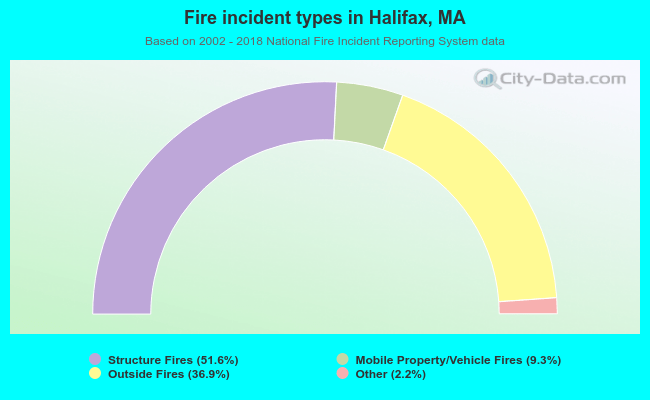 When looking into fire subcategories, the most reports belonged to: Structure Fires (51.6%), and Outside Fires (36.9%).