Greensburg: Fire Incidents, Pennsylvania (PA)
Where are fire incidents reported in Greensburg, PA
Something went wrong! Please refresh the page.
| Fire incidents reported | |
|---|---|
| Sreet name | Count |
| MAIN ST | 714 |
| PITTSBURGH ST | 464 |
| WALNUT AVE | 446 |
| THIRD ST | 422 |
| COLLEGE AVE | 396 |
| GARDEN CENTER DR | 270 |
| ROUTE 30 | 260 |
| DIVISION ST | 254 |
| MAPLE AVE | 210 |
| OTTERMAN ST | 194 |
| SETON HILL DR | 164 |
| GRANDE BLVD | 152 |
| GEORGE ST | 140 |
| EASTMONT DR | 136 |
| PENNSYLVANIA AVE | 108 |
| WAYNE AVE | 104 |
| HIGHLAND AVE | 96 |
| FOSTER ST | 90 |
| BROAD ST | 84 |
| CENTER AVE | 82 |
| HARRISON AVE | 82 |
| EUCLID AVE | 76 |
| CULBERTSON AVE | 74 |
| ANGELA DR | 64 |
| CHESTNUT ST | 62 |
| HUMPHREY RD | 58 |
| 819 RT | 56 |
| ALEXANDER ST | 56 |
| GREENGATE CENTRE CIR | 56 |
| TREMONT AVE | 56 |
| Other | 948 |
2004 - 2018 National Fire Incident Reporting System (NFIRS) incidents
- Incident types reported to NFIRS in Greensburg, PA
- 6,37433.0%Fire
- 3,97820.6%False Alarm
- 2,95715.3%Good Intent Call
- 2,64013.7%Rescue & EMS
- 2,54313.2%Hazardous Condition
- 5733.0%Service Call
- 1660.9%Severe Weather
- 580.3%Special Incident
- Fire incident types reported to NFIRS in Greensburg, PA
- 4,58071.9%Structure Fires
- 73211.5%Outside Fires
- 71311.2%Other
- 3495.5%Mobile Property/Vehicle Fires
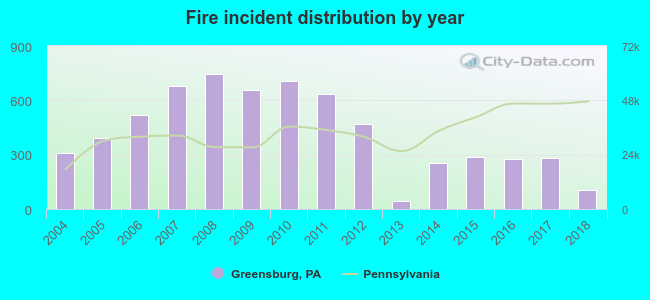 According to the data from the years 2004 - 2018 the average number of fires per year is 425. The highest number of reported fire incidents - 748 took place in 2008, and the least - 43 in 2013. The data has a declining trend.
The average number of yearly fire incidents per 10k residents in Greensburg, PA compared to nearest cities:
(Note: Based on data for the last 3 years, including only cities with population 5,000 and above)
| Greensburg: | 152.8 |
| Jeannette: | 77.0 |
| Latrobe: | 150.9 |
| Murrysville: | 22.5 |
| White Oak: | 18.3 |
| North Versailles: | 41.8 |
| Monroeville: | 27.7 |
| Turtle Creek: | 43.4 |
| McKeesport: | 43.3 |
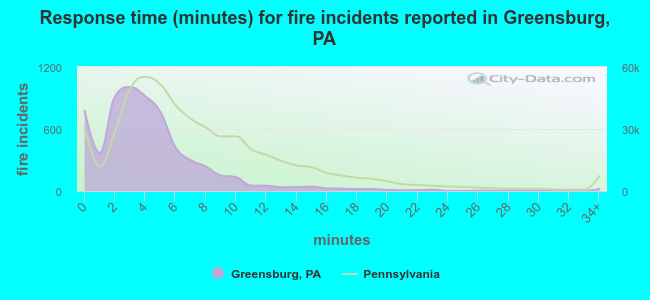 The median response time based on all reported fire incidents is 4 minutes. This is lower compared to the Pennsylvania median value.
The median response time in Greensburg, PA compared to nearest cities:
(Note: Based on data for all years, including only cities with at least 500 fire incidents)
| Greensburg: | 4 minutes |
| Jeannette: | 4 minutes |
| Irwin: | 5 minutes |
| Latrobe: | 4 minutes |
| Export: | 2 minutes |
| New Alexandria: | 2 minutes |
| Murrysville: | 6 minutes |
| Derry: | 8 minutes |
| Monroeville: | 6 minutes |
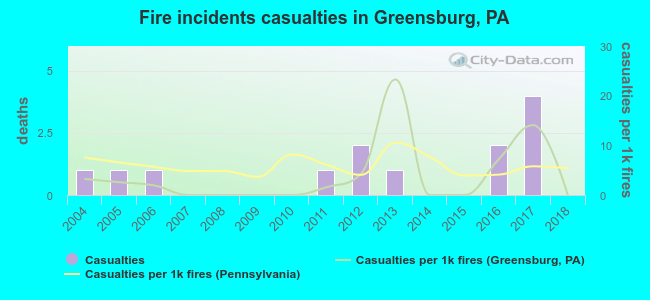 According to the reports from the years 2004 - 2018 the average number of fire-related yearly casualties is 1. The highest number of injuries - 4 took place in 2017, and the lowest - 0 in 2007. The data has a declining trend.
The average number of casualties per 1,000 fires is 4. This indicator was the highest - 23 in 2013, and the lowest 0 in 2007. The trend for injuries per 1,000 fire incidents is declining. Compared to the state value the number of injuries per 1,000 fires is much lower.
According to the reports from the years 2004 - 2018 the average number of fire-related yearly casualties is 1. The highest number of injuries - 4 took place in 2017, and the lowest - 0 in 2007. The data has a declining trend.
The average number of casualties per 1,000 fires is 4. This indicator was the highest - 23 in 2013, and the lowest 0 in 2007. The trend for injuries per 1,000 fire incidents is declining. Compared to the state value the number of injuries per 1,000 fires is much lower.Casualties per 1,000 incidents in Greensburg, PA compared to nearest cities:
(Note: Based on data for all years, including only cities with at least 500 fire incidents)
| Greensburg: | 2.0 |
| Jeannette: | 7.5 |
| Irwin: | 4.0 |
| Latrobe: | 2.9 |
| Export: | 1.9 |
| New Alexandria: | 1.8 |
| Murrysville: | 1.9 |
| Derry: | 0.0 |
| Monroeville: | 0.0 |
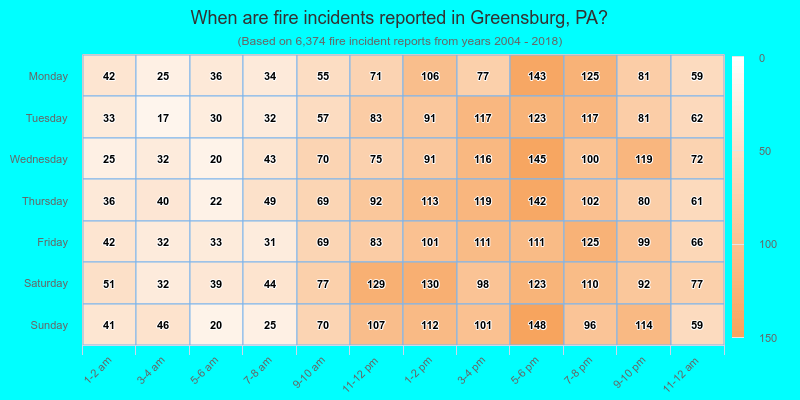
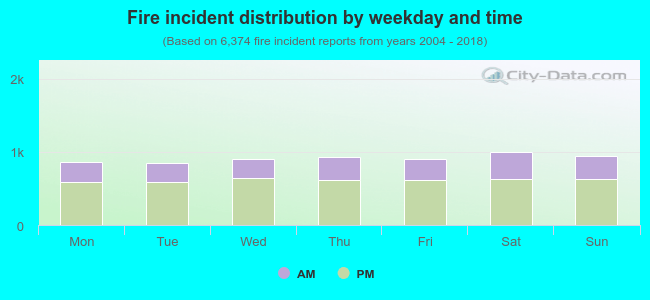 32.3% incidents where reported in the morning and 67.7% in the evening. The most fires (15.7%) took place on Saturday, and the least (13.2%) on Tuesday.
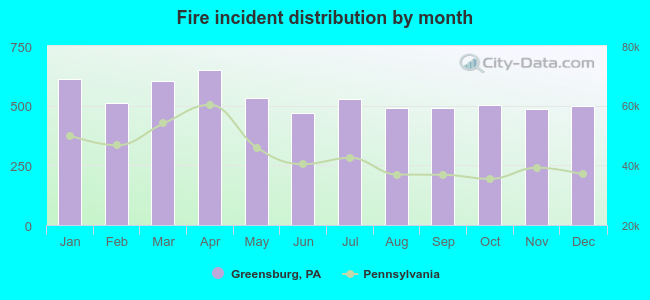 Based on the 6,374 incident reports from years 2004 - 2018 most fires (10.2%) took place during April, and the least (7.3%) in June.
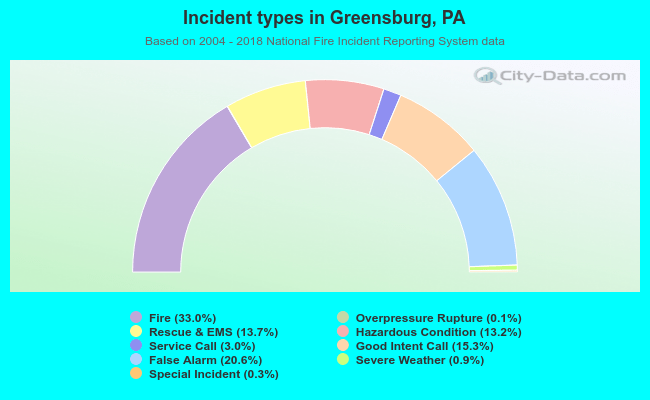 Out of all 19,300 cases reported during the years 2004 - 2018, the most belonged to the categories: Fire (33.0%), False Alarm (20.6%), and Good Intent Call (15.3%).
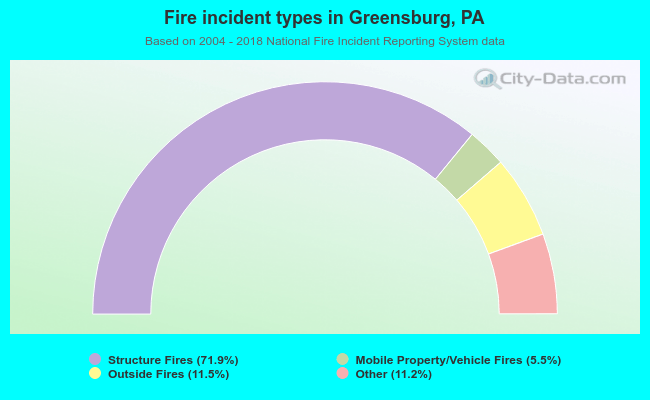 When looking into fire subcategories, the most reports belonged to: Structure Fires (71.9%), and Outside Fires (11.5%).