Glen Ellen: Fire Incidents, California (CA)
Where are fire incidents reported in Glen Ellen, CA
Something went wrong! Please refresh the page.
|
| |||||||||||||||||||||||||||||||||||||||||||||||||||||||||||||||||||||||||||||||||||||||||||||||||||||||||||||
2005 - 2018 National Fire Incident Reporting System (NFIRS) incidents
- Incident types reported to NFIRS in Glen Ellen, CA
- 76940.1%Rescue & EMS
- 44423.1%Hazardous Condition
- 28314.7%Good Intent Call
- 23112.0%Fire
- 1145.9%Service Call
- 693.6%False Alarm
- 40.2%Special Incident
- 30.2%Overpressure Rupture
- 20.1%Severe Weather
- Fire incident types reported to NFIRS in Glen Ellen, CA
- 12755.0%Outside Fires
- 7432.0%Structure Fires
- 2410.4%Mobile Property/Vehicle Fires
- 62.6%Other
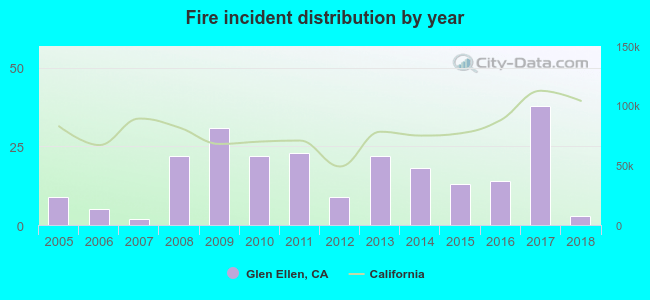 Based on the data from the years 2005 - 2018 the average number of fire incidents per year is 17. The highest number of fires - 38 took place in 2017, and the least - 2 in 2007. The data has a declining trend.
 22.1% incidents where reported in the morning and 77.9% in the evening. The most fires (17.7%) took place on Saturday, and the least (7.4%) on Monday.
 According to the 231 fire incidents from years 2005 - 2018 most fires (11.3%) took place during July, and the least (5.6%) in May.
 Out of all 1,919 cases reported during the years 2005 - 2018, the most belonged to the categories: Rescue & EMS (40.1%), Hazardous Condition (23.1%), and Good Intent Call (14.7%).
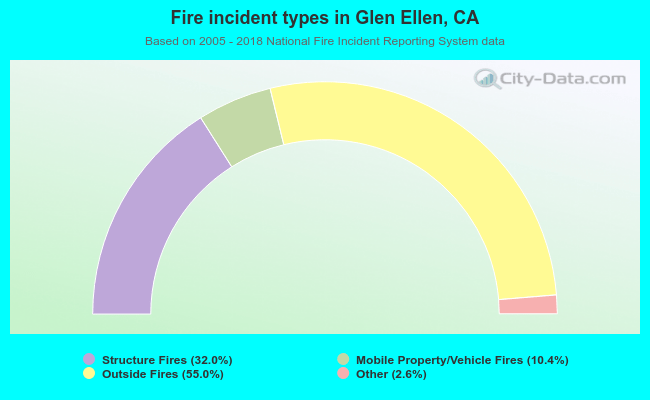 When looking into fire subcategories, the most reports belonged to: Outside Fires (55.0%), and Structure Fires (32.0%).