Glassboro: Fire Incidents, New Jersey (NJ)
Where are fire incidents reported in Glassboro, NJ
Something went wrong! Please refresh the page.
| Fire incidents reported | |
|---|---|
| Sreet name | Count |
| DELSEA DR | 166 |
| MULLICA HILL RD | 150 |
| BEAU RIVAGE | 126 |
| HIGH ST | 96 |
| DELSEA DRIVE | 92 |
| ROWAN BLVD | 62 |
| RT 55 | 56 |
| EDGEWOOD DR | 54 |
| MAIN ST | 54 |
| ACADEMY ST | 42 |
| TOWNHOUSE DR | 40 |
| EDGEWOOD | 32 |
| RUTH AVE | 32 |
| GROVE ST | 28 |
| ELLIS ST | 26 |
| STANGER AVE | 26 |
| AURA RD | 24 |
| REDMOND AVE | 24 |
| WHIG LANE RD | 24 |
| HIGGINS DR | 22 |
| NEW ST | 22 |
| ROUTE 55 HWY | 22 |
| BUCK RD | 20 |
| ELK RD | 20 |
| DELSEA | 18 |
| DEPTFORD RD | 18 |
| BRIDGETON PIKE | 16 |
| BRIDGETON PIKE | 16 |
| SEWELL ST | 16 |
| STATE ST | 16 |
2004 - 2018 National Fire Incident Reporting System (NFIRS) incidents
- Incident types reported to NFIRS in Glassboro, NJ
- 1,93930.1%False Alarm
- 1,59524.8%Hazardous Condition
- 1,19218.5%Fire
- 66610.3%Service Call
- 6129.5%Rescue & EMS
- 4046.3%Good Intent Call
- 190.3%Severe Weather
- 80.1%Overpressure Rupture
- 80.1%Special Incident
- Fire incident types reported to NFIRS in Glassboro, NJ
- 55046.1%Structure Fires
- 43436.4%Outside Fires
- 12210.2%Mobile Property/Vehicle Fires
- 867.2%Other
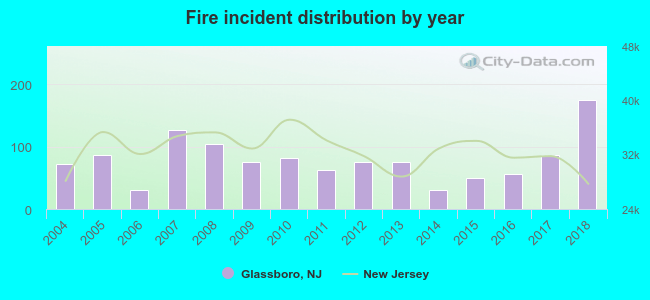 According to the data from the years 2004 - 2018 the average number of fires per year is 79. The highest number of fire incidents - 174 took place in 2018, and the least - 31 in 2006. The data has a rising trend.
The average number of yearly fire incidents per 10k residents in Glassboro, NJ compared to nearest cities:
(Note: Based on data for the last 3 years, including only cities with population 5,000 and above)
| Glassboro: | 55.6 |
| Pitman: | 48.3 |
| Clayton: | 9.6 |
| Williamstown: | 24.6 |
| Pine Hill: | 69.8 |
| Woodbury: | 68.6 |
| Stratford: | 51.4 |
| Lindenwold: | 36.9 |
| Runnemede: | 46.2 |
 The median response time based on all reported fire incidents is 5 minutes. This is comparable to the state median value.
The median response time in Glassboro, NJ compared to nearest cities:
(Note: Based on data for all years, including only cities with at least 500 fire incidents)
| Glassboro: | 5 minutes |
| Turnersville: | 7 minutes |
| Mullica Hill: | 9 minutes |
| Williamstown: | 8 minutes |
| Blackwood: | 6 minutes |
| Pine Hill: | 6 minutes |
| Woodbury: | 7 minutes |
| Clementon: | 6 minutes |
| Lindenwold: | 7 minutes |
 35.7% incidents where reported in the morning and 64.3% in the evening. The most fires (16.4%) took place on Monday, and the least (11.7%) on Wednesday.
 Based on the 1,192 fire incidents from years 2004 - 2018 most fires (11.9%) took place during April, and the least (5.0%) in August.
 Out of all 6,443 cases reported during the years 2004 - 2018, the most belonged to the categories: False Alarm (30.1%), Hazardous Condition (24.8%), and Fire (18.5%).
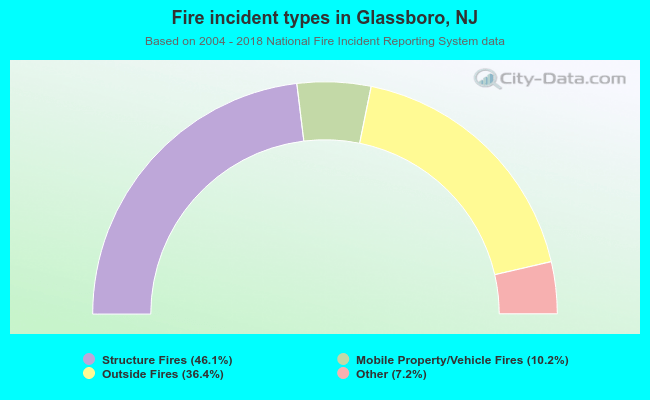 When looking into fire subcategories, the most reports belonged to: Structure Fires (46.1%), and Outside Fires (36.4%).