Geronimo: Fire Incidents, Texas (TX)
Where are fire incidents reported in Geronimo, TX
Something went wrong! Please refresh the page.
|
| |||||||||||||||||||||||||||||||||||||||||||||||||||||||||||||||||||||||||||||||||||||||||||||||||||||||||||||
2003 - 2018 National Fire Incident Reporting System (NFIRS) incidents
- Incident types reported to NFIRS in Geronimo, TX
- 12956.1%Fire
- 6528.3%Rescue & EMS
- 198.3%Good Intent Call
- 114.8%Hazardous Condition
- 41.7%Service Call
- 20.9%False Alarm
- Fire incident types reported to NFIRS in Geronimo, TX
- 9775.2%Outside Fires
- 1713.2%Structure Fires
- 1310.1%Mobile Property/Vehicle Fires
- 21.6%Other
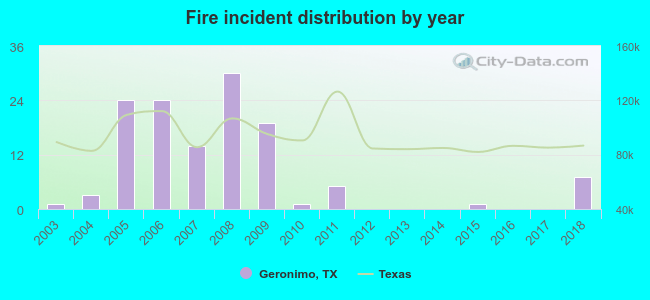 Based on the data from the years 2003 - 2018 the average number of fires per year is 8. The highest number of fire incidents - 30 took place in 2008, and the least - 0 in 2012. The data has a growing trend.
 20.9% incidents where reported in the morning and 79.1% in the evening. The most fires (17.1%) took place on Monday, and the least (7.0%) on Friday.
 Based on the 129 incident reports from years 2003 - 2018 most fires (14.0%) took place during June, and the least (4.7%) in September.
 Out of all 230 cases reported during the years 2003 - 2018, the most belonged to the categories: Fire (56.1%), Overpressure Rupture (28.3%), and Service Call (8.3%).
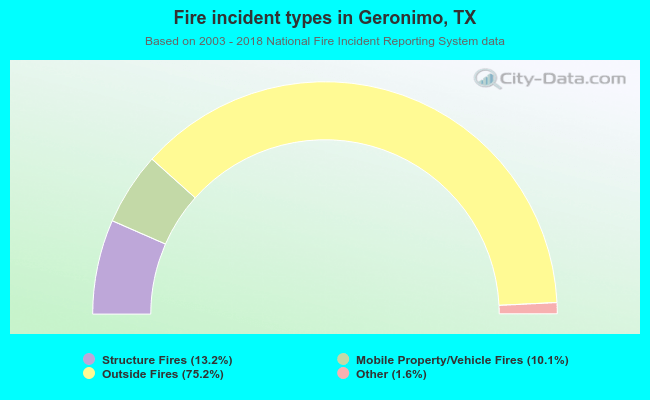 When looking into fire subcategories, the most reports belonged to: Outside Fires (75.2%), and Structure Fires (13.2%).