Gainesville: Fire Incidents, Florida (FL)
Where are fire incidents reported in Gainesville, FL
Something went wrong! Please refresh the page.
| Fire incidents reported | |
|---|---|
| Sreet name | Count |
| 13TH ST | 448 |
| ARCHER RD | 294 |
| UNIVERSITY AV | 268 |
| 39TH AV | 258 |
| 15TH ST | 236 |
| MAIN ST | 198 |
| 16TH AV | 196 |
| 34TH ST | 184 |
| WALDO RD | 180 |
| 8TH AV | 166 |
| NEWBERRY RD | 144 |
| 6TH ST | 130 |
| WILLISTON RD | 128 |
| 4TH ST | 110 |
| 12TH ST | 106 |
| 35TH PL | 106 |
| 2ND ST | 100 |
| 9TH ST | 100 |
| 2ND AV | 98 |
| 43RD ST | 94 |
| HAWTHORNE RD | 92 |
| 4TH AV | 90 |
| 23RD AV | 88 |
| 5TH AV | 78 |
| 11TH ST | 76 |
| 16TH | 76 |
| 8TH ST | 74 |
| 28TH DR | 72 |
| 39TH | 72 |
| 1ST AV | 70 |
| Other | 3,210 |
2004 - 2018 National Fire Incident Reporting System (NFIRS) incidents
- Incident types reported to NFIRS in Gainesville, FL
- 72,52367.5%Rescue & EMS
- 10,83010.1%Good Intent Call
- 8,1857.6%Hazardous Condition
- 7,5427.0%Fire
- 6,3065.9%False Alarm
- 1,7711.6%Service Call
- 1760.2%Special Incident
- Fire incident types reported to NFIRS in Gainesville, FL
- 3,34044.3%Outside Fires
- 2,86438.0%Structure Fires
- 1,07714.3%Mobile Property/Vehicle Fires
- 2613.5%Other
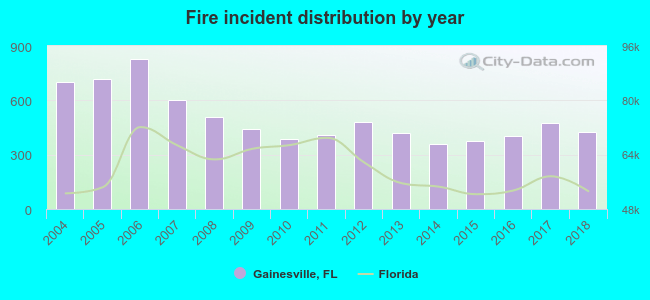 Based on the data from the years 2004 - 2018 the average number of fire incidents per year is 503. The highest number of reported fires - 827 took place in 2006, and the least - 361 in 2014. The data has a decreasing trend.
The average number of yearly fire incidents per 10k residents in Gainesville, FL compared to nearest cities:
(Note: Based on data for the last 3 years, including only cities with population 5,000 and above)
| Gainesville: | 33.8 |
| Alachua: | 48.1 |
| Newberry: | 81.3 |
| High Springs: | 17.0 |
| Starke: | 142.4 |
| Ocala: | 141.4 |
| Middleburg: | 6.9 |
| Lake City: | 288.4 |
| Palatka: | 64.5 |
 The median response time based on all reported fire incidents is 6 minutes. This is comparable to the state median value.
The median response time in Gainesville, FL compared to nearest cities:
(Note: Based on data for all years, including only cities with at least 500 fire incidents)
| Gainesville: | 6 minutes |
| Micanopy: | 11 minutes |
| Alachua: | 10 minutes |
| Hawthorne: | 12 minutes |
| Newberry: | 9 minutes |
| High Springs: | 9 minutes |
| Keystone Heights: | 11 minutes |
| Williston: | 9 minutes |
| Reddick: | 11 minutes |
 According to the reports from the years 2004 - 2018 the average number of fire-related fatalities per year is 1. The highest number of deaths - 6 took place in 2006, and the lowest - 0 in 2004. The data has a rising trend.
The average number of deaths per 1,000 fires is 2. This indicator was the highest - 7 in 2006, and the lowest 0 in 2004. The trend for deaths per 1,000 incidents is increasing. Compared to the state value the number of fatalities per 1,000 fires is similar.
According to the reports from the years 2004 - 2018 the average number of fire-related fatalities per year is 1. The highest number of deaths - 6 took place in 2006, and the lowest - 0 in 2004. The data has a rising trend.
The average number of deaths per 1,000 fires is 2. This indicator was the highest - 7 in 2006, and the lowest 0 in 2004. The trend for deaths per 1,000 incidents is increasing. Compared to the state value the number of fatalities per 1,000 fires is similar.
 Based on the reports from the years 2004 - 2018 the average number of fire-related yearly casualties is 3. The highest number of casualties - 5 took place in 2005, and the lowest - 1 in 2010. The data has a decreasing trend.
The average number of injuries per 1,000 fire incidents is 5. This indicator was the highest - 11 in 2014, and the lowest 2 in 2017. The trend for casualties per 1,000 fire incidents is declining. Compared to the state value the number of casualties per 1,000 fire incidents is much lower.
Based on the reports from the years 2004 - 2018 the average number of fire-related yearly casualties is 3. The highest number of casualties - 5 took place in 2005, and the lowest - 1 in 2010. The data has a decreasing trend.
The average number of injuries per 1,000 fire incidents is 5. This indicator was the highest - 11 in 2014, and the lowest 2 in 2017. The trend for casualties per 1,000 fire incidents is declining. Compared to the state value the number of casualties per 1,000 fire incidents is much lower.Casualties per 1,000 incidents in Gainesville, FL compared to nearest cities:
(Note: Based on data for all years, including only cities with at least 500 fire incidents)
| Gainesville: | 5.3 |
| Micanopy: | 0.0 |
| Alachua: | 2.1 |
| Hawthorne: | 2.8 |
| Newberry: | 1.8 |
| High Springs: | 1.9 |
| Keystone Heights: | 2.0 |
| Williston: | 1.9 |
| Reddick: | 5.7 |
 29.0% incidents where reported in the morning and 71.0% in the evening. The most fires (15.6%) took place on Saturday, and the least (13.3%) on Thursday.
 According to the 7,542 fires from years 2004 - 2018 most fires (10.6%) took place during April, and the least (5.9%) in August.
 Out of all 107,448 cases reported during the years 2004 - 2018, the most belonged to the categories: Rescue & EMS (67.5%), Good Intent Call (10.1%), and Hazardous Condition (7.6%).
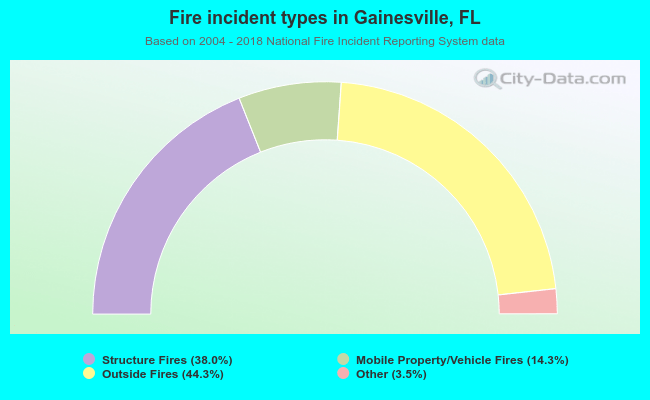 When looking into fire subcategories, the most incidents belonged to: Outside Fires (44.3%), and Structure Fires (38.0%).