Espanola: Fire Incidents, New Mexico (NM)
Where are fire incidents reported in Espanola, NM
Something went wrong! Please refresh the page.
|
| |||||||||||||||||||||||||||||||||||||||||||||||||||||||||||||||||||||||||||||||||||||||||||||||||||||||||||||
| Other | 278 | |||||||||||||||||||||||||||||||||||||||||||||||||||||||||||||||||||||||||||||||||||||||||||||||||||||||||||||
2006 - 2018 National Fire Incident Reporting System (NFIRS) incidents
- Incident types reported to NFIRS in Espanola, NM
- 7,05365.6%Rescue & EMS
- 1,0289.6%Good Intent Call
- 9078.4%Hazardous Condition
- 9068.4%Fire
- 4314.0%Service Call
- 4053.8%False Alarm
- 140.1%Special Incident
- Fire incident types reported to NFIRS in Espanola, NM
- 37941.8%Structure Fires
- 36039.7%Outside Fires
- 11612.8%Mobile Property/Vehicle Fires
- 515.6%Other
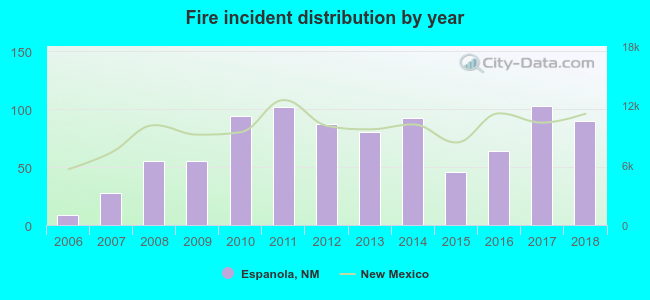 Based on the data from the years 2006 - 2018 the average number of fire incidents per year is 70. The highest number of fire incidents - 103 took place in 2017, and the least - 9 in 2006. The data has a growing trend.
The average number of yearly fire incidents per 10k residents in Espanola, NM compared to nearest cities:
(Note: Based on data for the last 3 years, including only cities with population 5,000 and above)
| Espanola: | 84.6 |
| San Juan Pueblo: | 1.5 |
| White Rock: | 7.6 |
| Los Alamos: | 14.1 |
| Santa Fe: | 24.3 |
| Eldorado at Santa Fe: | 21.2 |
| Taos: | 109.8 |
 The median response time based on all reported fire incidents is 5 minutes. This is lower than the state median value.
The median response time in Espanola, NM compared to nearest cities:
(Note: Based on data for all years, including only cities with at least 500 fire incidents)
| Espanola: | 5 minutes |
| Chimayo: | 18 minutes |
| Santa Fe: | 7 minutes |
| La Cienega: | 15 minutes |
| Taos: | 7 minutes |
 29.8% incidents where reported in the morning and 70.2% in the evening. The most fires (15.9%) took place on Saturday, and the least (12.1%) on Wednesday.
 Based on the 906 reports from years 2006 - 2018 most fires (12.4%) took place during March, and the least (5.4%) in October.
 Out of all 10,749 cases reported during the years 2006 - 2018, the most belonged to the categories: Rescue & EMS (65.6%), Good Intent Call (9.6%), and Hazardous Condition (8.4%).
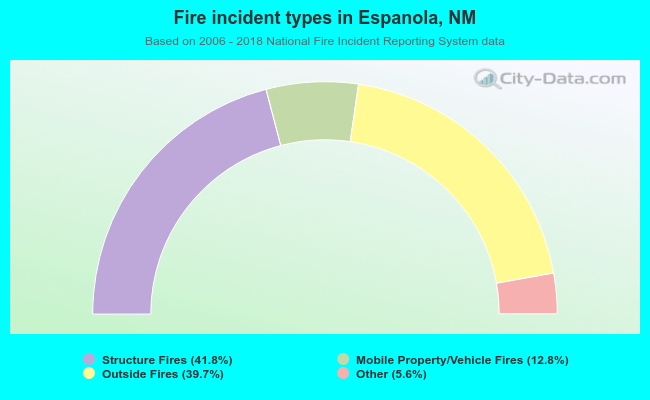 When looking into fire subcategories, the most reports belonged to: Structure Fires (41.8%), and Outside Fires (39.7%).