Encinal: Fire Incidents, Texas (TX)
Where are fire incidents reported in Encinal, TX
Something went wrong! Please refresh the page.
|
| |||||||||||||||||||||||||||||||||||||||||||||||||||||||||||||||||||||||||||||||||||||||||||||||||||||||||||||
2009 - 2018 National Fire Incident Reporting System (NFIRS) incidents
- Incident types reported to NFIRS in Encinal, TX
- 39265.4%Rescue & EMS
- 14023.4%Fire
- 498.2%Good Intent Call
- 81.3%Hazardous Condition
- 50.8%Service Call
- 30.5%False Alarm
- 20.3%Special Incident
- Fire incident types reported to NFIRS in Encinal, TX
- 8460.0%Outside Fires
- 3424.3%Mobile Property/Vehicle Fires
- 128.6%Structure Fires
- 107.1%Other
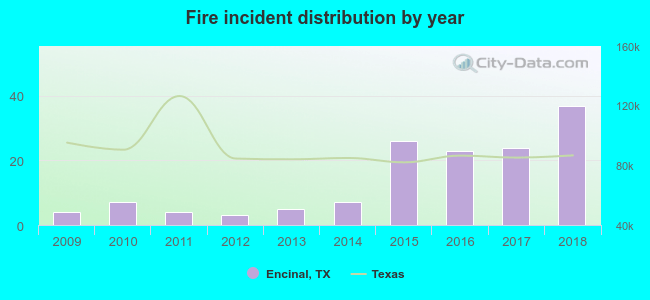 Based on the data from the years 2009 - 2018 the average number of fire incidents per year is 14. The highest number of fires - 37 took place in 2018, and the least - 3 in 2012. The data has a growing trend.
 20.7% incidents where reported in the morning and 79.3% in the evening. The most fires (17.9%) took place on Monday, and the least (11.4%) on Wednesday.
 Based on the 140 fire incidents from years 2009 - 2018 most fires (15.7%) took place during August, and the least (5.0%) in October.
 Out of all 599 cases reported during the years 2009 - 2018, the most belonged to the categories: Overpressure Rupture (65.4%), Fire (23.4%), and Service Call (8.2%).
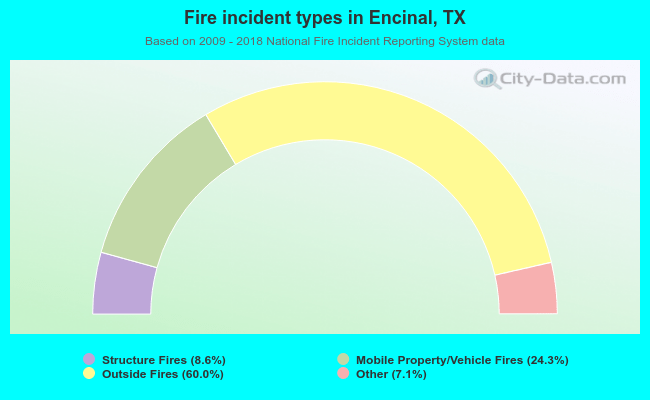 When looking into fire subcategories, the most reports belonged to: Outside Fires (60.0%), and Mobile Property/Vehicle Fires (24.3%).