Elyria: Fire Incidents, Ohio (OH)
Where are fire incidents reported in Elyria, OH
Something went wrong! Please refresh the page.
| Fire incidents reported | |
|---|---|
| Sreet name | Count |
| WEST RIVER RD | 294 |
| ABBE RD | 256 |
| MIDDLE AVE | 196 |
| BROAD ST | 160 |
| LAKE AVE | 122 |
| EAST AVE | 114 |
| WEST AVE | 106 |
| CLEVELAND ST | 104 |
| EAST RIVER ST | 96 |
| OBERLIN RD | 86 |
| MIDWAY MALL | 78 |
| ROUTE 57 HWY | 70 |
| CHESTNUT ST | 66 |
| MIDWAY BL | 66 |
| LOWELL ST | 62 |
| NINTH ST | 62 |
| WASHINGTON AVE | 62 |
| INFIRMARY RD | 60 |
| FOURTH ST | 52 |
| PROSPECT ST | 52 |
| FURNACE ST | 50 |
| GARDEN ST | 50 |
| GRISWOLD RD | 50 |
| EAST AV | 48 |
| GULF RD | 48 |
| MELVYN LN | 48 |
| OAKWOOD DR | 48 |
| ROSEWOOD DR | 48 |
| TELEGRAPH RD | 48 |
| WEST RIDGE RD | 48 |
| Other | 1,112 |
2002 - 2018 National Fire Incident Reporting System (NFIRS) incidents
- Incident types reported to NFIRS in Elyria, OH
- 13,86148.4%Rescue & EMS
- 3,87913.5%Hazardous Condition
- 3,76213.1%Fire
- 2,3668.3%Service Call
- 2,2968.0%False Alarm
- 2,0987.3%Good Intent Call
- 3251.1%Overpressure Rupture
- Fire incident types reported to NFIRS in Elyria, OH
- 1,80548.0%Structure Fires
- 1,33835.6%Outside Fires
- 59615.8%Mobile Property/Vehicle Fires
- 230.6%Other
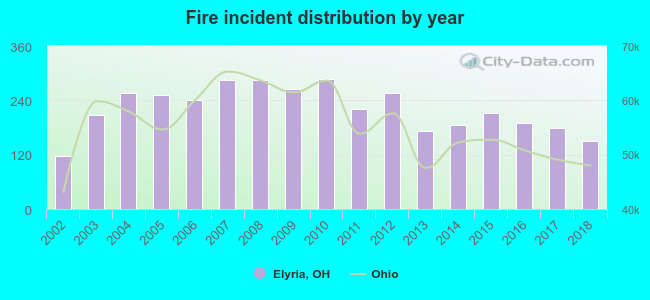 According to the data from the years 2002 - 2018 the average number of fire incidents per year is 221. The highest number of fire incidents - 287 took place in 2010, and the least - 116 in 2002. The data has a growing trend.
The average number of yearly fire incidents per 10k residents in Elyria, OH compared to nearest cities:
(Note: Based on data for the last 3 years, including only cities with population 5,000 and above)
| Elyria: | 32.0 |
| North Ridgeville: | 19.5 |
| Lorain: | 54.4 |
| Amherst: | 59.8 |
| Avon: | 32.6 |
| Grafton: | 85.6 |
| Sheffield Lake: | 48.2 |
| Oberlin: | 58.6 |
| North Olmsted: | 39.7 |
 The median response time based on all reported fire incidents is 5 minutes. This is lower compared to the Ohio median value.
The median response time in Elyria, OH compared to nearest cities:
(Note: Based on data for all years, including only cities with at least 500 fire incidents)
| Elyria: | 5 minutes |
| North Ridgeville: | 6 minutes |
| Lorain: | 5 minutes |
| Amherst: | 9 minutes |
| Avon: | 7 minutes |
| Grafton: | 10 minutes |
| Sheffield Lake: | 6 minutes |
| Oberlin: | 6 minutes |
| North Olmsted: | 4 minutes |
 Based on the data from the years 2002 - 2018 the average number of fire-related yearly deaths is 1. The highest number of reported deaths - 3 took place in 2009, and the lowest - 0 in 2004. The data has a constant trend.
The average number of deaths per 1,000 fire incidents is 4. This indicator was the highest - 11 in 2009, and the lowest 0 in 2004. The trend for fatalities per 1,000 fire incidents is declining. Compared to the state value the number of fatalities per 1,000 fires is higher.
Based on the data from the years 2002 - 2018 the average number of fire-related yearly deaths is 1. The highest number of reported deaths - 3 took place in 2009, and the lowest - 0 in 2004. The data has a constant trend.
The average number of deaths per 1,000 fire incidents is 4. This indicator was the highest - 11 in 2009, and the lowest 0 in 2004. The trend for fatalities per 1,000 fire incidents is declining. Compared to the state value the number of fatalities per 1,000 fires is higher.
 According to the reports from the years 2002 - 2018 the average number of fire-related yearly casualties is 8. The highest number of casualties - 14 took place in 2011, and the lowest - 0 in 2002. The data has a rising trend.
The average number of casualties per 1,000 fires is 35. This indicator was the highest - 75 in 2013, and the lowest 0 in 2002. The trend for casualties per 1,000 fires is increasing. Compared to the state value the number of injuries per 1,000 fire incidents is much higher.
According to the reports from the years 2002 - 2018 the average number of fire-related yearly casualties is 8. The highest number of casualties - 14 took place in 2011, and the lowest - 0 in 2002. The data has a rising trend.
The average number of casualties per 1,000 fires is 35. This indicator was the highest - 75 in 2013, and the lowest 0 in 2002. The trend for casualties per 1,000 fires is increasing. Compared to the state value the number of injuries per 1,000 fire incidents is much higher.Casualties per 1,000 incidents in Elyria, OH compared to nearest cities:
(Note: Based on data for all years, including only cities with at least 500 fire incidents)
| Elyria: | 34.0 |
| North Ridgeville: | 11.0 |
| Lorain: | 20.8 |
| Amherst: | 8.3 |
| Avon: | 16.3 |
| Grafton: | 1.2 |
| Sheffield Lake: | 22.5 |
| Oberlin: | 18.5 |
| North Olmsted: | 10.2 |
 33.5% incidents where reported in the morning and 66.5% in the evening. The most fires (15.2%) took place on Wednesday, and the least (13.3%) on Saturday.
 Based on the 3,762 incident reports from years 2002 - 2018 most fires (11.9%) took place during July, and the least (6.6%) in December.
 Out of all 28,636 cases reported during the years 2002 - 2018, the most belonged to the categories: Rescue & EMS (48.4%), Hazardous Condition (13.5%), and Fire (13.1%).
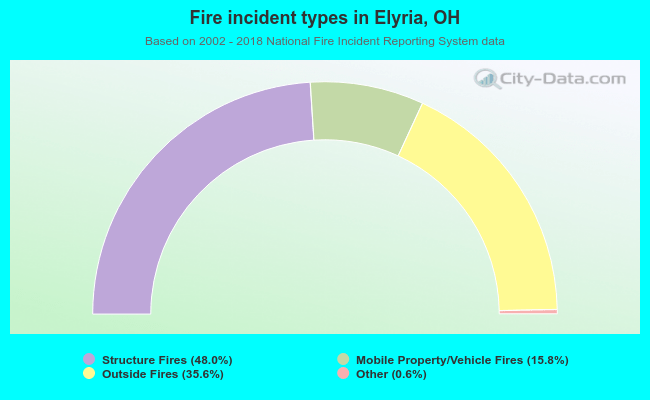 When looking into fire subcategories, the most reports belonged to: Structure Fires (48.0%), and Outside Fires (35.6%).