| Fire incidents reported |
|---|
| Sreet name | Count |
|---|
| FM 1739 | 24 | | HWY 240 | 20 | | FM 2384 | 18 | | US HWY 287 NB | 18 | | CLEVELAND ST | 14 | | US HWY 287 SB | 14 | | BAILEY ST | 12 | | BUSINESS 287 | 12 | | GLISSON ST | 12 | | WAGGONER ST | 12 | | ELECTRA ST | 10 | | FRONT ST | 10 | | HWY 25 | 10 | | HWY 25 N | 10 | | US HWY 287 | 10 | | 1739 AND BICKLEY RD | 8 | | 287 AND BURNETT HWY | 8 | | HWY 25 SOUTH | 8 | | HWY 287 | 8 | | JENNINGS RD | 8 | | ROOSEVELT ST | 8 | | US 287 | 8 | | 25 HWY | 6 | | 25LAZY J RD | 6 | | 2871739 HWY | 6 |
| | | Fire incidents reported |
|---|
| Sreet name | Count |
|---|
| 2872384 HWY | 6 | | 287MIDWAY CHURCH HWY | 6 | | 287WILBARGER COUNTY LINE HWY | 6 | | BUSINESS 287 SB | 6 | | MAIN ST | 6 | | WHARTON ST | 6 | | 240 HWY | 4 | | 25LAZY J RDS | 4 | | 287 MIDWAY CHURCH HWY | 4 | | 2876 MILE HWY | 4 | | 287COUNTY LINE ROAD HWY | 4 | | 287FM1739 HWY | 4 | | 287FM2384 HWY | 4 | | 287PATTON RNCH HWY | 4 | | BAILEY | 4 | | BRYAN ST | 4 | | CLEVELAND AVE | 4 | | COUNTY LINE ROAD | 4 | | EAST VIEW HOMES DOUGLAS STREE | 4 | | ELECTRA | 4 | | FM 2326 | 4 | | GLISSON | 4 | | HARRISON ST | 4 | | HWY 25 S | 4 | | |
|
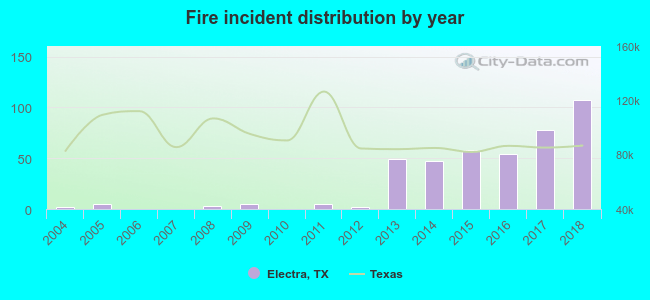 According to the data from the years 2004 - 2018 the average number of fires per year is 28. The highest number of reported fire incidents - 107 took place in 2018, and the least - 0 in 2006. The data has an increasing trend.
 25.1% incidents where reported in the morning and 74.9% in the evening. The most fires (16.1%) took place on Friday, and the least (11.3%) on Saturday.
 According to the 415 incident reports from years 2004 - 2018 most fires (16.1%) took place during July, and the least (3.9%) in December.
 Out of all 843 cases reported during the years 2004 - 2018, the most belonged to the categories: Fire (49.2%), Hazardous Condition (21.8%), and Rescue & EMS (14.0%).
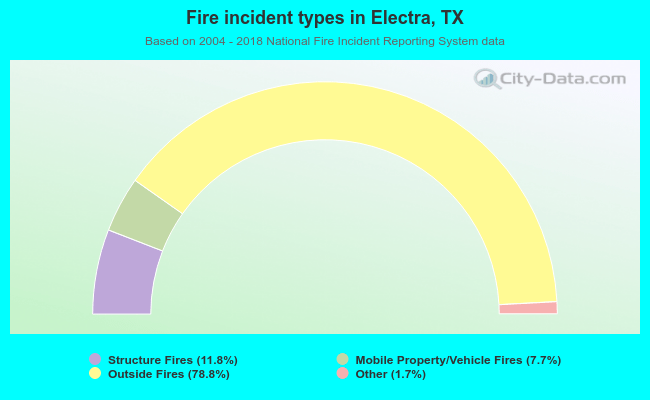 When looking into fire subcategories, the most reports belonged to: Outside Fires (78.8%), and Structure Fires (11.8%).