| Fire incidents reported |
|---|
| Sreet name | Count |
|---|
| HWY 19 | 12 | | FM 859 | 8 | | VZCR 3104 | 8 | | VZCR 3710 | 8 | | 140 VZCR 3505 | 4 | | CR 3705 | 4 | | FM 1504 | 4 | | HWY 80 | 4 | | VZCR 3106 | 4 | | VZCR 3613 | 4 | | 000 VZCR 3105 | 2 | | 1015 VZCR 3103 | 2 | | 1040 VZCR 3215 | 2 | | 1052 VZCR 3216 | 2 | | 107 WS FRONT ST | 2 | | 109 VZCR 3508 | 2 | | 120 VZ CR 3613 | 2 | | 15840 HWY 80 | 2 | | 15864 US HWY 80 | 2 | | 1825 VZCR 1905 | 2 | | 19500 HWY 80 | 2 | | 1960 VZCR 3601 | 2 | | 2038 VZCR 3103 | 2 | | 281 VZCR 1102 | 2 | | 290 VZ CNTY RD 3508 | 2 |
| | | Fire incidents reported |
|---|
| Sreet name | Count |
|---|
| 290 VZCR 3111 | 2 | | 291 VZCR 3216 | 2 | | 2922 VZCR 3105 | 2 | | 302 PR 7293 | 2 | | 311VZCR 3705 | 2 | | 399 VZCR 3111 | 2 | | 403 S MAIN ST | 2 | | 420VZCR 3110 | 2 | | 4236 VZCR 1903 | 2 | | 506 WALNUT | 2 | | 5154 FM RD 1504 | 2 | | 601 VZCR 3602 | 2 | | 610 VZCR3613 | 2 | | 663VZCR 3605 | 2 | | 750 VZCR 3104 | 2 | | 778 CROOKED CREEK | 2 | | 7942 FM 859 | 2 | | 811 E PINE | 2 | | 8113 HWY 19 | 2 | | 8166 HWY 19 | 2 | | 843 VZ CR 3122 | 2 | | 891 VZCR 3605 | 2 | | 952 PR7213 VZCR3213 | 2 | | CR 3507 | 2 | | |
|
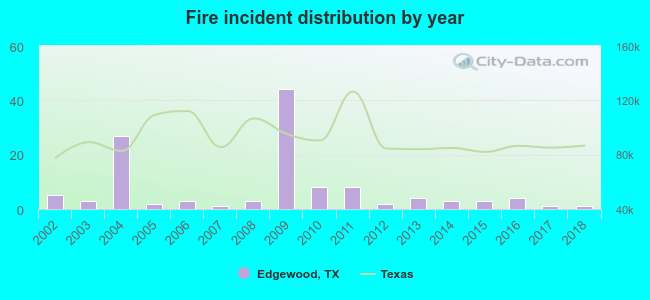 Based on the data from the years 2002 - 2018 the average number of fire incidents per year is 7. The highest number of reported fire incidents - 44 took place in 2009, and the least - 1 in 2007. The data has a declining trend.
 24.6% incidents where reported in the morning and 75.4% in the evening. The most fires (22.1%) took place on Sunday, and the least (9.8%) on Tuesday.
 Based on the 122 fire incident reports from years 2002 - 2018 most fires (24.6%) took place during January, and the least (1.6%) in October.
 Out of all 214 cases reported during the years 2002 - 2018, the most belonged to the categories: Fire (57.0%), Service Call (21.0%), and Overpressure Rupture (11.2%).
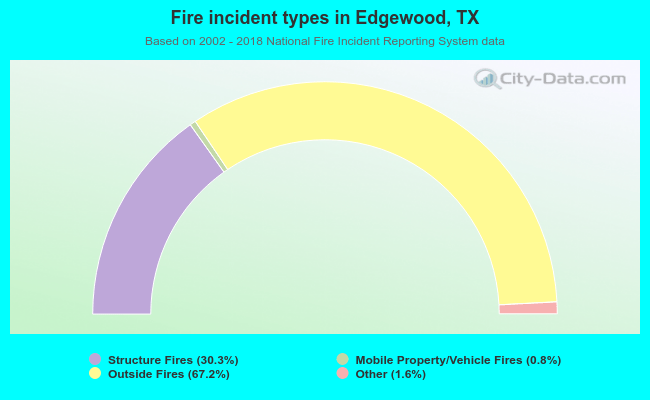 When looking into fire subcategories, the most incidents belonged to: Outside Fires (67.2%), and Structure Fires (30.3%).