Duchesne: Fire Incidents, Utah (UT)
Where are fire incidents reported in Duchesne, UT
Something went wrong! Please refresh the page.
|
| |||||||||||||||||||||||||||||||||||||||||||||||||||||||||||||||||||||||||||||||||||||||||||||||||||||||||||||
| Other | 62 | |||||||||||||||||||||||||||||||||||||||||||||||||||||||||||||||||||||||||||||||||||||||||||||||||||||||||||||
2002 - 2018 National Fire Incident Reporting System (NFIRS) incidents
- Incident types reported to NFIRS in Duchesne, UT
- 20269.9%Fire
- 3813.1%Hazardous Condition
- 248.3%False Alarm
- 113.8%Good Intent Call
- 82.8%Rescue & EMS
- 41.4%Service Call
- 10.3%Overpressure Rupture
- 10.3%Severe Weather
- Fire incident types reported to NFIRS in Duchesne, UT
- 10652.5%Outside Fires
- 5024.8%Structure Fires
- 3517.3%Mobile Property/Vehicle Fires
- 115.4%Other
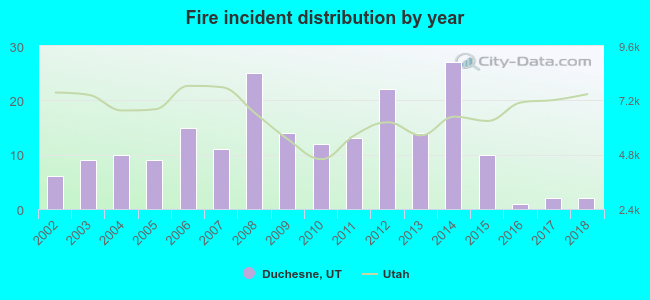 Based on the data from the years 2002 - 2018 the average number of fire incidents per year is 12. The highest number of fires - 27 took place in 2014, and the least - 1 in 2016. The data has a dropping trend.
 According to the data from the years 2002 - 2018 the average number of fire-related yearly casualties is 0. The highest number of injuries - 1 took place in 2004, and the lowest - 0 in 2002. The data has a constant trend.
 27.7% incidents where reported in the morning and 72.3% in the evening. The most fires (18.3%) took place on Friday, and the least (8.4%) on Thursday.
 According to the 202 fire incidents from years 2002 - 2018 most fires (16.8%) took place during July, and the least (3.0%) in January.
 Out of all 289 cases reported during the years 2002 - 2018, the most belonged to the categories: Fire (69.9%), Hazardous Condition (13.1%), and False Alarm (8.3%).
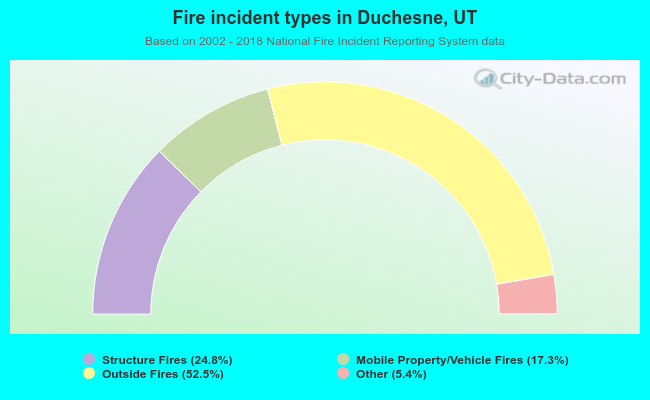 When looking into fire subcategories, the most reports belonged to: Outside Fires (52.5%), and Structure Fires (24.8%).