Dover: Fire Incidents, New Jersey (NJ)
Where are fire incidents reported in Dover, NJ
Something went wrong! Please refresh the page.
| Fire incidents reported | |
|---|---|
| Sreet name | Count |
| BLACKWELL ST | 386 |
| SPRUCE ST | 236 |
| BASSETT HWY | 212 |
| SUSSEX ST | 104 |
| MORRIS ST | 80 |
| COMMERCE CENTER DR | 76 |
| RICHARDS AVE | 70 |
| CLINTON ST | 62 |
| WARREN ST | 58 |
| MCFARLAN ST | 54 |
| BERRY ST | 44 |
| ROUTE 46 | 38 |
| PROSPECT ST | 36 |
| THOMPSON AVE | 36 |
| DICKERSON ST | 34 |
| PRINCETON AVE | 30 |
| BERGEN ST | 28 |
| LIBERTY ST | 28 |
| MUNSON AVE | 28 |
| RICHBOYTON RD | 22 |
| PENN AVE | 20 |
| ELM ST | 18 |
| LIVINGSTON AVE | 18 |
| MOUNT HOPE AVE | 18 |
| PEQUANNOCK ST | 18 |
| BAKER ST | 16 |
| LEONARD ST | 16 |
| MONMOUTH AVE | 16 |
| ROSWELL ST | 16 |
| CHRYSTAL ST | 14 |
2002 - 2018 National Fire Incident Reporting System (NFIRS) incidents
- Incident types reported to NFIRS in Dover, NJ
- 2,65738.5%Rescue & EMS
- 1,25318.2%Fire
- 1,11716.2%False Alarm
- 91813.3%Hazardous Condition
- 5027.3%Good Intent Call
- 4186.1%Service Call
- 160.2%Overpressure Rupture
- 130.2%Special Incident
- Fire incident types reported to NFIRS in Dover, NJ
- 90672.3%Structure Fires
- 24019.2%Outside Fires
- 917.3%Mobile Property/Vehicle Fires
- 161.3%Other
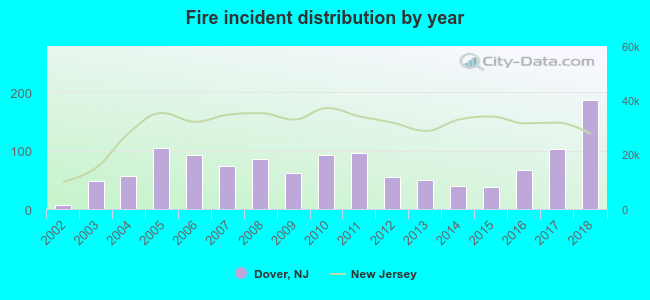 Based on the data from the years 2002 - 2018 the average number of fires per year is 74. The highest number of fires - 186 took place in 2018, and the least - 6 in 2002. The data has an increasing trend.
The average number of yearly fire incidents per 10k residents in Dover, NJ compared to nearest cities:
(Note: Based on data for the last 3 years, including only cities with population 5,000 and above)
| Dover: | 64.8 |
| Wharton: | 24.2 |
| Rockaway: | 57.6 |
| Succasunna: | 19.3 |
| Mount Arlington: | 23.7 |
| Morris Plains: | 79.7 |
| Hopatcong: | 7.3 |
| Morristown: | 43.7 |
| Boonton: | 25.8 |
 The median response time based on all reported fire incidents is 3 minutes. This is lower than the New Jersey median value.
The median response time in Dover, NJ compared to nearest cities:
(Note: Based on data for all years, including only cities with at least 500 fire incidents)
| Dover: | 3 minutes |
| Rockaway: | 8 minutes |
| Morris Plains: | 4 minutes |
| Morristown: | 3 minutes |
| Budd Lake: | 0 minutes |
| Kinnelon: | 5 minutes |
| Long Valley: | 10 minutes |
| Fairfield: | 5 minutes |
| Livingston: | 0 minutes |
 Based on the reports from the years 2002 - 2018 the average number of fire-related yearly casualties is 1. The highest number of casualties - 5 took place in 2018, and the lowest - 0 in 2002. The data has an increasing trend.
The average number of casualties per 1,000 fire incidents is 8. This indicator was the highest - 60 in 2016, and the lowest 0 in 2002. The trend for injuries per 1,000 fires is growing. Compared to the New Jersey value the number of injuries per 1,000 fire incidents is higher.
Based on the reports from the years 2002 - 2018 the average number of fire-related yearly casualties is 1. The highest number of casualties - 5 took place in 2018, and the lowest - 0 in 2002. The data has an increasing trend.
The average number of casualties per 1,000 fire incidents is 8. This indicator was the highest - 60 in 2016, and the lowest 0 in 2002. The trend for injuries per 1,000 fires is growing. Compared to the New Jersey value the number of injuries per 1,000 fire incidents is higher.Casualties per 1,000 incidents in Dover, NJ compared to nearest cities:
(Note: Based on data for all years, including only cities with at least 500 fire incidents)
| Dover: | 10.4 |
| Rockaway: | 9.2 |
| Morris Plains: | 1.5 |
| Morristown: | 7.9 |
| Budd Lake: | 2.3 |
| Kinnelon: | 1.9 |
| Long Valley: | 0.0 |
| Fairfield: | 0.0 |
| Livingston: | 5.2 |
 30.7% incidents where reported in the morning and 69.3% in the evening. The most fires (16.7%) took place on Monday, and the least (12.7%) on Wednesday.
 Based on the 1,253 fires from years 2002 - 2018 most fires (11.8%) took place during October, and the least (6.9%) in June.
 Out of all 6,899 cases reported during the years 2002 - 2018, the most belonged to the categories: Rescue & EMS (38.5%), Fire (18.2%), and False Alarm (16.2%).
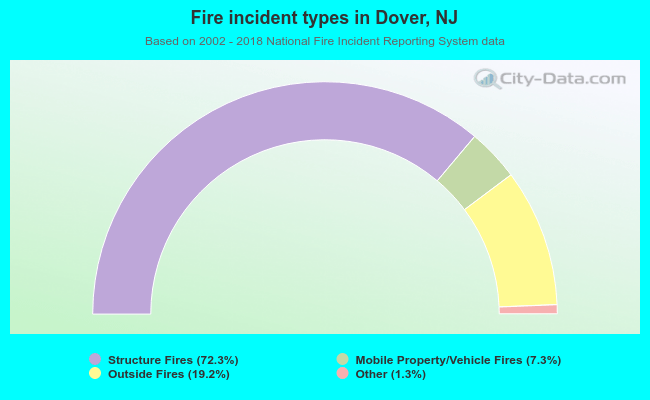 When looking into fire subcategories, the most reports belonged to: Structure Fires (72.3%), and Outside Fires (19.2%).