Detroit: Fire Incidents, Michigan (MI)
Where are fire incidents reported in Detroit, MI
Something went wrong! Please refresh the page.
| Fire incidents reported | |
|---|---|
| Sreet name | Count |
| 7 MILE RD | 1,350 |
| OUTER DR | 1,008 |
| GRAND BLVD | 954 |
| WARREN AVE | 912 |
| GRAND RIVER AVE | 818 |
| JEFFERSON AVE | 780 |
| MCNICHOLS RD | 756 |
| LIVERNOIS AVE | 728 |
| GREENFIELD RD | 678 |
| GRATIOT AVE | 654 |
| VERNOR HWY | 636 |
| 8 MILE RD | 588 |
| CENTRAL ST | 520 |
| JOY RD | 502 |
| MICHIGAN AVE | 478 |
| FORT ST | 454 |
| FENKELL ST | 442 |
| STOUT ST | 440 |
| VAN DYKE ST | 436 |
| WOODWARD AVE | 432 |
| WYOMING ST | 416 |
| SCHAEFER HWY | 404 |
| CONCORD ST | 392 |
| STATE FAIR ST | 392 |
| VAUGHAN ST | 386 |
| HARPER AVE | 382 |
| PLYMOUTH RD | 382 |
| MACK AVE | 370 |
| COYLE ST | 364 |
| CHALMERS ST | 362 |
| Other | 56,994 |
2002 - 2018 National Fire Incident Reporting System (NFIRS) incidents
- Incident types reported to NFIRS in Detroit, MI
- 74,41031.9%Fire
- 72,35631.1%Rescue & EMS
- 37,19516.0%Hazardous Condition
- 22,0459.5%False Alarm
- 21,6299.3%Good Intent Call
- 2,5761.1%Service Call
- 2,3221.0%Special Incident
- 3050.1%Overpressure Rupture
- Fire incident types reported to NFIRS in Detroit, MI
- 45,23860.8%Structure Fires
- 14,80619.9%Mobile Property/Vehicle Fires
- 13,94918.7%Outside Fires
- 4170.6%Other
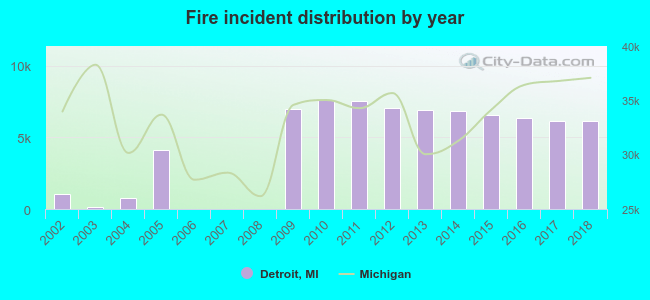 Based on the data from the years 2002 - 2018 the average number of fires per year is 4,377. The highest number of fire incidents - 7,595 took place in 2010, and the least - 13 in 2007. The data has a growing trend.
The average number of yearly fire incidents per 10k residents in Detroit, MI compared to nearest cities:
(Note: Based on data for the last 3 years, including only cities with population 5,000 and above)
| Detroit: | 91.5 |
| Highland Park: | 197.9 |
| Hamtramck: | 73.8 |
| Hazel Park: | 35.3 |
| Ferndale: | 32.1 |
| Oak Park: | 30.4 |
| Huntington Woods: | 15.2 |
| Center Line: | 78.6 |
| Dearborn: | 28.1 |
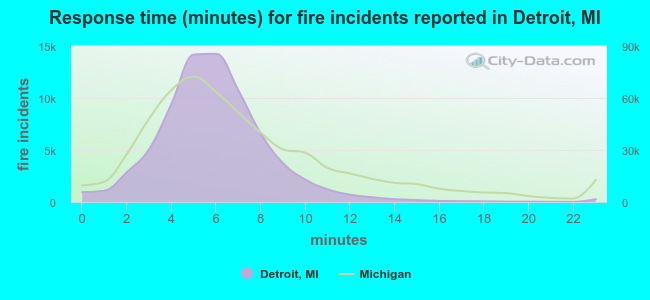 The median response time based on all reported fire incidents is 6 minutes. This is comparable to the Michigan median value.
The median response time in Detroit, MI compared to nearest cities:
(Note: Based on data for all years, including only cities with at least 500 fire incidents)
| Detroit: | 6 minutes |
| Highland Park: | 4 minutes |
| Hamtramck: | 3 minutes |
| Hazel Park: | 4 minutes |
| Ferndale: | 4 minutes |
| Oak Park: | 3 minutes |
| Center Line: | 3 minutes |
| Dearborn: | 4 minutes |
| Madison Heights: | 3 minutes |
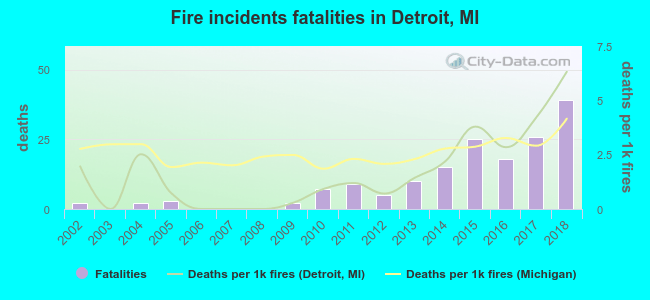 According to the data from the years 2002 - 2018 the average number of fire-related fatalities per year is 10. The highest number of reported deaths - 39 took place in 2018, and the lowest - 0 in 2003. The data has a rising trend.
The average number of deaths per 1,000 fires is 2. This indicator was the highest - 6 in 2018, and the lowest 0 in 2003. The trend for fatalities per 1,000 incidents is rising. Compared to the state value the number of deaths per 1,000 incidents is similar.
According to the data from the years 2002 - 2018 the average number of fire-related fatalities per year is 10. The highest number of reported deaths - 39 took place in 2018, and the lowest - 0 in 2003. The data has a rising trend.
The average number of deaths per 1,000 fires is 2. This indicator was the highest - 6 in 2018, and the lowest 0 in 2003. The trend for fatalities per 1,000 incidents is rising. Compared to the state value the number of deaths per 1,000 incidents is similar.Deaths per 1,000 incidents in Detroit, MI compared to nearest cities:
(Note: Based on data for all years, including only cities with at least 2,500 fire incidents)
| Detroit: | 2.2 |
| Dearborn: | 1.8 |
| Warren: | 2.2 |
| Southfield: | 3.1 |
| Roseville: | 3.9 |
| Troy: | 1.8 |
| Taylor: | 3.2 |
| Sterling Heights: | 2.4 |
| Pontiac: | 3.8 |
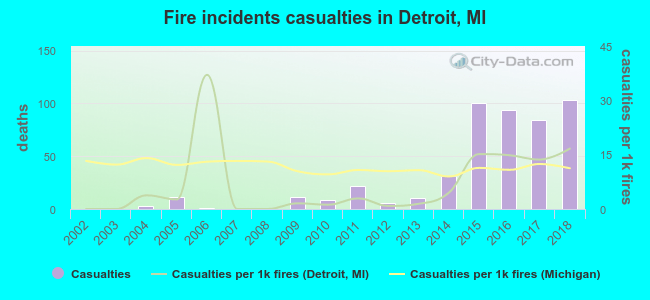 According to the data from the years 2002 - 2018 the average number of fire-related casualties per year is 29. The highest number of reported casualties - 103 took place in 2018, and the lowest - 0 in 2002. The data has a rising trend.
The average number of casualties per 1,000 fires is 7. This indicator was the highest - 37 in 2006, and the lowest 0 in 2002. The trend for injuries per 1,000 fires is growing. Compared to the state value the number of injuries per 1,000 fire incidents is lower.
According to the data from the years 2002 - 2018 the average number of fire-related casualties per year is 29. The highest number of reported casualties - 103 took place in 2018, and the lowest - 0 in 2002. The data has a rising trend.
The average number of casualties per 1,000 fires is 7. This indicator was the highest - 37 in 2006, and the lowest 0 in 2002. The trend for injuries per 1,000 fires is growing. Compared to the state value the number of injuries per 1,000 fire incidents is lower.Casualties per 1,000 incidents in Detroit, MI compared to nearest cities:
(Note: Based on data for all years, including only cities with at least 500 fire incidents)
| Detroit: | 6.5 |
| Highland Park: | 3.4 |
| Hamtramck: | 2.4 |
| Hazel Park: | 21.9 |
| Ferndale: | 33.1 |
| Oak Park: | 9.2 |
| Center Line: | 31.9 |
| Dearborn: | 23.8 |
| Madison Heights: | 10.5 |
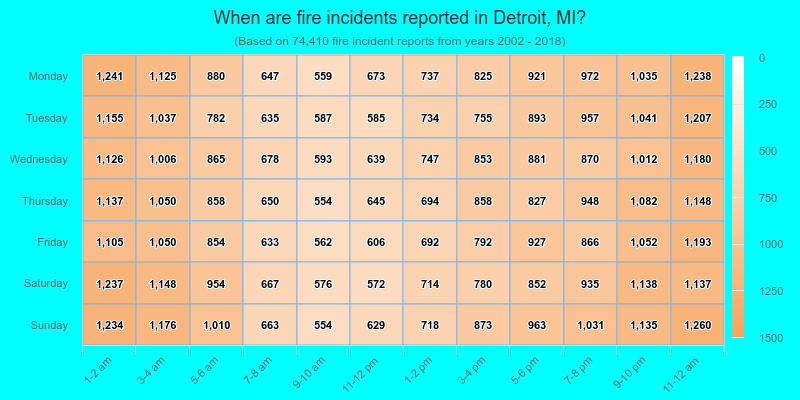
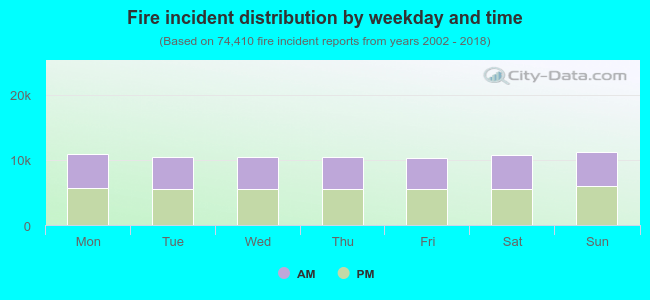 47.0% incidents where reported in the morning and 53.0% in the evening. The most fires (15.1%) took place on Sunday, and the least (13.9%) on Friday.
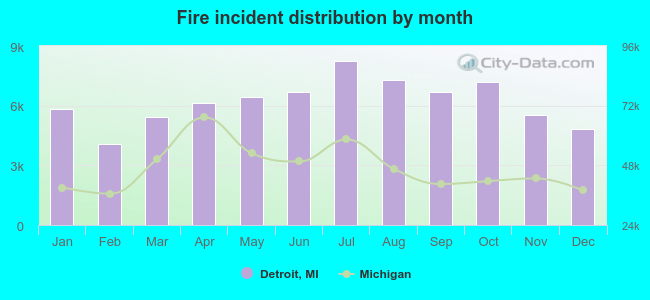 Based on the 74,410 fires from years 2002 - 2018 most fires (11.1%) took place during July, and the least (5.5%) in February.
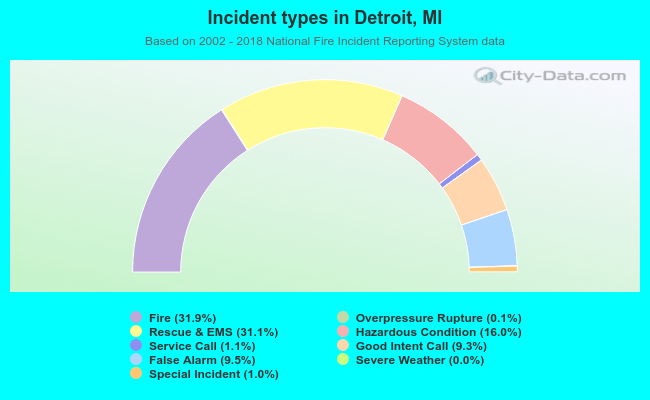 Out of all 232,911 cases reported during the years 2002 - 2018, the most belonged to the categories: Fire (31.9%), Rescue & EMS (31.1%), and Hazardous Condition (16.0%).
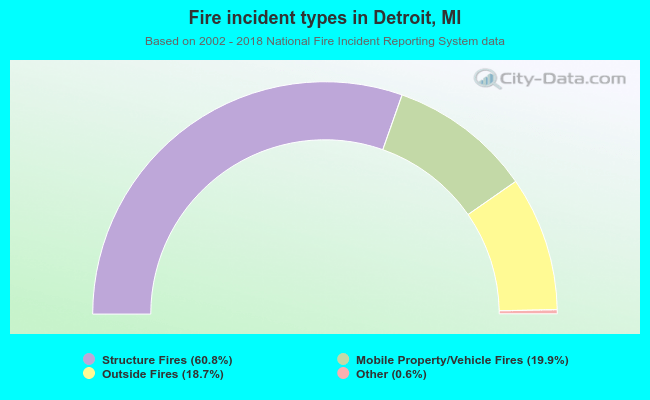 When looking into fire subcategories, the most incidents belonged to: Structure Fires (60.8%), and Mobile Property/Vehicle Fires (19.9%).