Comanche: Fire Incidents, Texas (TX)
Where are fire incidents reported in Comanche, TX
Something went wrong! Please refresh the page.
|
| |||||||||||||||||||||||||||||||||||||||||||||||||||||||||||||||||||||||||||||||||||||||||||||||||||||||||||||
| Other | 16 | |||||||||||||||||||||||||||||||||||||||||||||||||||||||||||||||||||||||||||||||||||||||||||||||||||||||||||||
2002 - 2018 National Fire Incident Reporting System (NFIRS) incidents
- Incident types reported to NFIRS in Comanche, TX
- 18858.0%Fire
- 5817.9%Hazardous Condition
- 3410.5%Rescue & EMS
- 237.1%Good Intent Call
- 185.6%Service Call
- 30.9%False Alarm
- Fire incident types reported to NFIRS in Comanche, TX
- 9751.6%Outside Fires
- 5428.7%Structure Fires
- 2010.6%Other
- 179.0%Mobile Property/Vehicle Fires
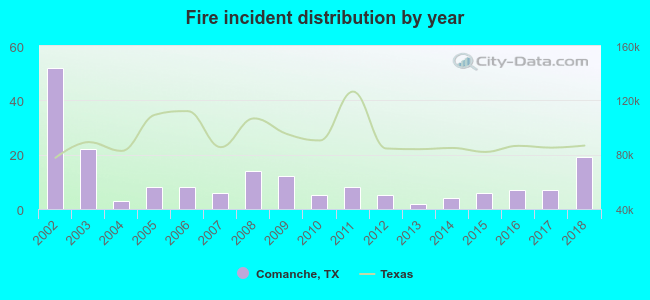 Based on the data from the years 2002 - 2018 the average number of fires per year is 11. The highest number of reported fire incidents - 52 took place in 2002, and the least - 2 in 2013. The data has a decreasing trend.
 24.5% incidents where reported in the morning and 75.5% in the evening. The most fires (18.1%) took place on Wednesday, and the least (9.6%) on Friday.
 According to the 188 incident reports from years 2002 - 2018 most fires (17.6%) took place during January, and the least (3.7%) in November.
 Out of all 324 cases reported during the years 2002 - 2018, the most belonged to the categories: Fire (58.0%), Rescue & EMS (17.9%), and Overpressure Rupture (10.5%).
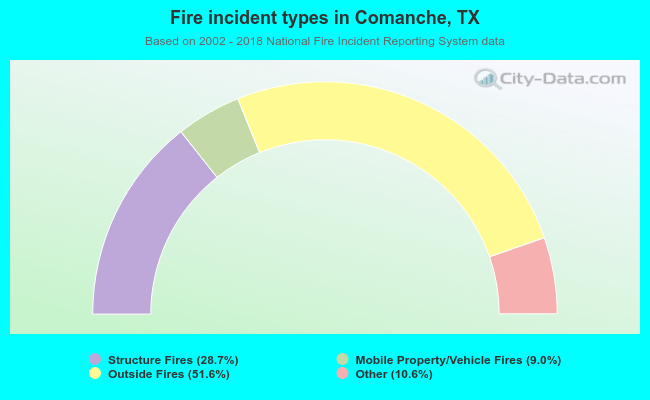 When looking into fire subcategories, the most incidents belonged to: Outside Fires (51.6%), and Structure Fires (28.7%).