Colton: Fire Incidents, California (CA)
Where are fire incidents reported in Colton, CA
Something went wrong! Please refresh the page.
| Fire incidents reported | |
|---|---|
| Sreet name | Count |
| WASHINGTON ST | 336 |
| VALLEY BLVD | 150 |
| LA CADENA DR | 146 |
| RANCHO AVE | 144 |
| MT VERNON AVE | 142 |
| SANTO ANTONIO DR | 86 |
| PEPPER AVE | 82 |
| RECHE CANYON RD | 76 |
| SAN BERNARDINO AVE | 76 |
| M ST | 72 |
| AGUA MANSA RD | 64 |
| MEADOW LN | 64 |
| C ST | 62 |
| 9TH ST | 52 |
| FAIRWAY DR | 52 |
| O ST | 50 |
| F ST | 48 |
| PENNSYLVANIA AVE | 48 |
| RIVERSIDE AVE | 48 |
| COOLEY DR | 44 |
| G ST | 44 |
| LAUREL ST | 42 |
| OLIVE ST | 40 |
| H ST | 36 |
| SPERRY DR | 36 |
| 7TH ST | 34 |
| BARTON RD | 32 |
| PELLISIER RD | 32 |
| EB I10 | 30 |
| CYPRESS AVE | 28 |
| Other | 332 |
2005 - 2018 National Fire Incident Reporting System (NFIRS) incidents
- Incident types reported to NFIRS in Colton, CA
- 9,48851.5%Rescue & EMS
- 4,06222.0%Good Intent Call
- 2,52813.7%Fire
- 8804.8%Service Call
- 7364.0%False Alarm
- 7113.9%Hazardous Condition
- 220.1%Special Incident
- Fire incident types reported to NFIRS in Colton, CA
- 1,32352.3%Outside Fires
- 57122.6%Structure Fires
- 47818.9%Mobile Property/Vehicle Fires
- 1566.2%Other
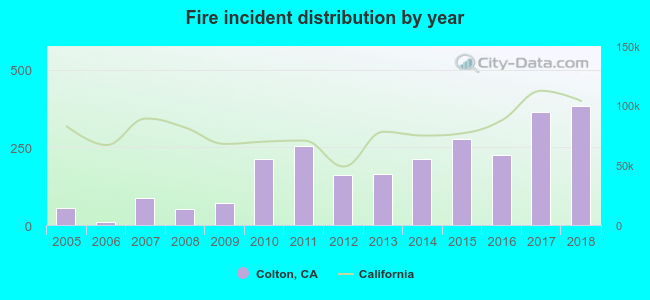 Based on the data from the years 2005 - 2018 the average number of fires per year is 181. The highest number of fires - 384 took place in 2018, and the least - 10 in 2006. The data has an increasing trend.
The average number of yearly fire incidents per 10k residents in Colton, CA compared to nearest cities:
(Note: Based on data for the last 3 years, including only cities with population 5,000 and above)
| Colton: | 60.0 |
| Grand Terrace: | 8.3 |
| Loma Linda: | 30.9 |
| Bloomington: | 11.2 |
| Rialto: | 4.3 |
| San Bernardino: | 22.7 |
| Muscoy: | 21.0 |
| Rubidoux: | 1.3 |
| Highland: | 2.4 |
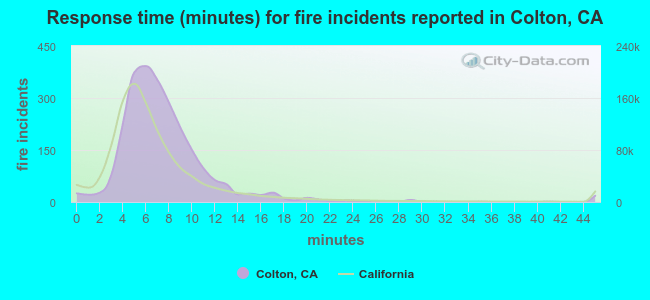 The median response time based on all reported fire incidents is 7 minutes. This is similar to the state median value.
The median response time in Colton, CA compared to nearest cities:
(Note: Based on data for all years, including only cities with at least 500 fire incidents)
| Colton: | 7 minutes |
| Loma Linda: | 6 minutes |
| Rialto: | 8 minutes |
| San Bernardino: | 7 minutes |
| Fontana: | 7 minutes |
| Redlands: | 6 minutes |
| Riverside: | 6 minutes |
| Rancho Cucamonga: | 7 minutes |
| Ontario: | 6 minutes |
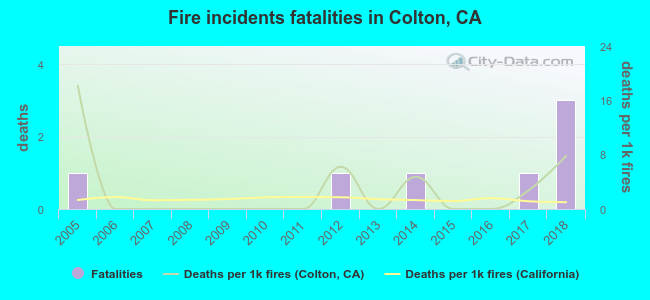 Based on the data from the years 2005 - 2018 the average number of fire-related yearly deaths is 1. The highest number of reported deaths - 3 took place in 2018, and the lowest - 0 in 2006. The data has an increasing trend.
The average number of fatalities per 1,000 fires is 3. This indicator was the highest - 18 in 2005, and the lowest 0 in 2006. The trend for deaths per 1,000 incidents is decreasing. Compared to the state value the number of deaths per 1,000 fires is higher.
Based on the data from the years 2005 - 2018 the average number of fire-related yearly deaths is 1. The highest number of reported deaths - 3 took place in 2018, and the lowest - 0 in 2006. The data has an increasing trend.
The average number of fatalities per 1,000 fires is 3. This indicator was the highest - 18 in 2005, and the lowest 0 in 2006. The trend for deaths per 1,000 incidents is decreasing. Compared to the state value the number of deaths per 1,000 fires is higher.Deaths per 1,000 incidents in Colton, CA compared to nearest cities:
(Note: Based on data for all years, including only cities with at least 2,500 fire incidents)
| Colton: | 2.8 |
| Redlands: | 0.6 |
| Riverside: | 2.5 |
| Rancho Cucamonga: | 1.5 |
| Ontario: | 1.6 |
| Pomona: | 0.5 |
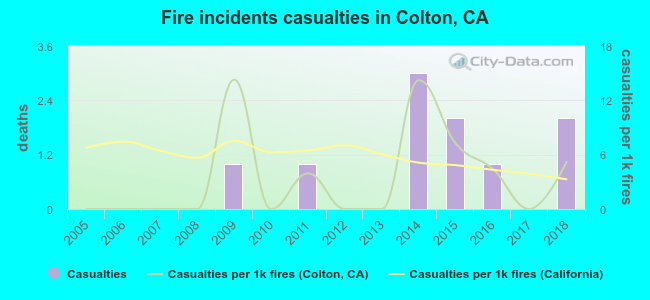 According to the data from the years 2005 - 2018 the average number of fire-related casualties per year is 1. The highest number of casualties - 3 took place in 2014, and the lowest - 0 in 2005. The data has a growing trend.
The average number of casualties per 1,000 fire incidents is 4. This indicator was the highest - 14 in 2009, and the lowest 0 in 2005. The trend for injuries per 1,000 fires is growing. Compared to the state value the number of injuries per 1,000 fire incidents is lower.
According to the data from the years 2005 - 2018 the average number of fire-related casualties per year is 1. The highest number of casualties - 3 took place in 2014, and the lowest - 0 in 2005. The data has a growing trend.
The average number of casualties per 1,000 fire incidents is 4. This indicator was the highest - 14 in 2009, and the lowest 0 in 2005. The trend for injuries per 1,000 fires is growing. Compared to the state value the number of injuries per 1,000 fire incidents is lower.Casualties per 1,000 incidents in Colton, CA compared to nearest cities:
(Note: Based on data for all years, including only cities with at least 500 fire incidents)
| Colton: | 4.0 |
| Loma Linda: | 5.9 |
| Rialto: | 14.3 |
| San Bernardino: | 4.3 |
| Fontana: | 2.1 |
| Redlands: | 5.5 |
| Riverside: | 23.0 |
| Rancho Cucamonga: | 15.6 |
| Ontario: | 14.5 |
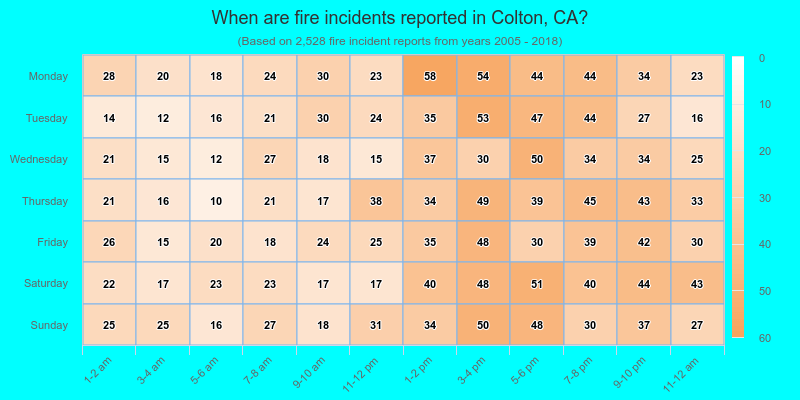
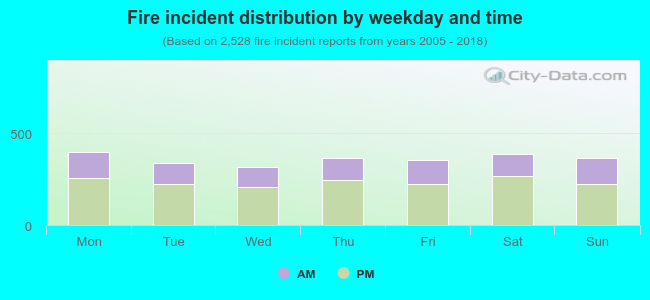 34.8% incidents where reported in the morning and 65.2% in the evening. The most fires (15.8%) took place on Monday, and the least (12.6%) on Wednesday.
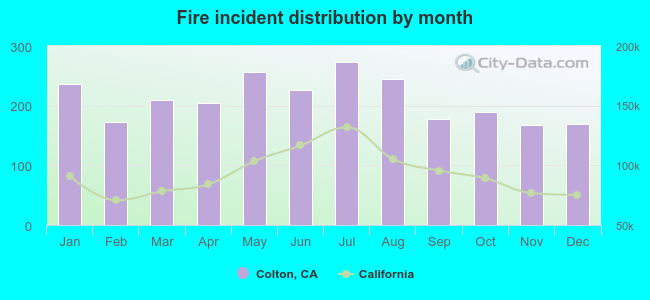 According to the 2,528 reports from years 2005 - 2018 most fires (10.8%) took place during July, and the least (6.6%) in November.
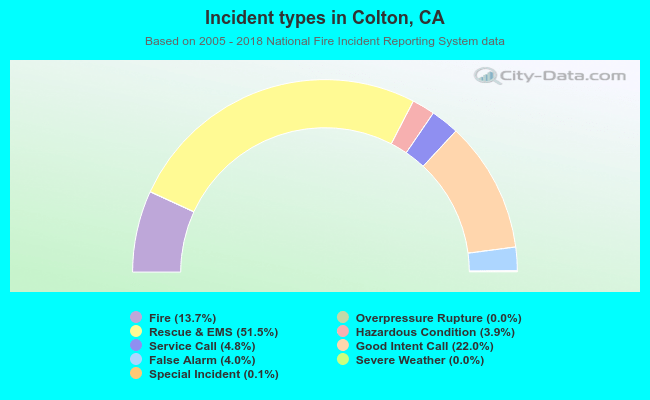 Out of all 18,437 cases reported during the years 2005 - 2018, the most belonged to the categories: Rescue & EMS (51.5%), Good Intent Call (22.0%), and Fire (13.7%).
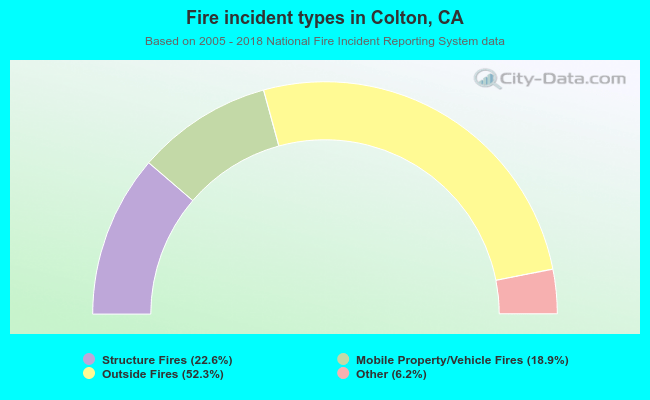 When looking into fire subcategories, the most incidents belonged to: Outside Fires (52.3%), and Structure Fires (22.6%).