Collinsville: Fire Incidents, Texas (TX)
Where are fire incidents reported in Collinsville, TX
Something went wrong! Please refresh the page.
|
| |||||||||||||||||||||||||||||||||||||||||||||||||||||||||||||||||||||||||||||||||||||||||||||||||||||||||||||
2004 - 2018 National Fire Incident Reporting System (NFIRS) incidents
- Incident types reported to NFIRS in Collinsville, TX
- 36241.7%Rescue & EMS
- 35841.2%Fire
- 637.3%Good Intent Call
- 424.8%Hazardous Condition
- 242.8%False Alarm
- 161.8%Service Call
- 20.2%Special Incident
- 10.1%Overpressure Rupture
- Fire incident types reported to NFIRS in Collinsville, TX
- 22964.0%Outside Fires
- 9125.4%Structure Fires
- 267.3%Mobile Property/Vehicle Fires
- 123.4%Other
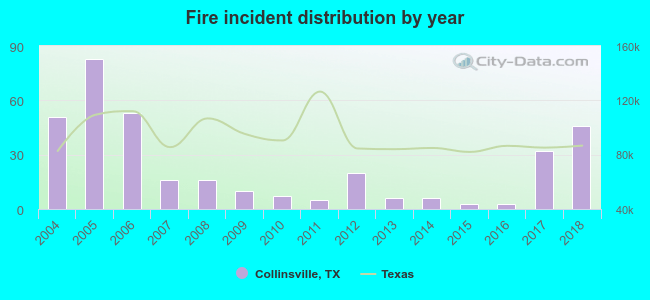 According to the data from the years 2004 - 2018 the average number of fires per year is 24. The highest number of fire incidents - 83 took place in 2005, and the least - 3 in 2015. The data has a declining trend.
 29.9% incidents where reported in the morning and 70.1% in the evening. The most fires (16.2%) took place on Monday, and the least (12.3%) on Thursday.
 According to the 358 fire incidents from years 2004 - 2018 most fires (13.4%) took place during March, and the least (3.6%) in May.
 Out of all 868 cases reported during the years 2004 - 2018, the most belonged to the categories: Rescue & EMS (41.7%), Fire (41.2%), and Good Intent Call (7.3%).
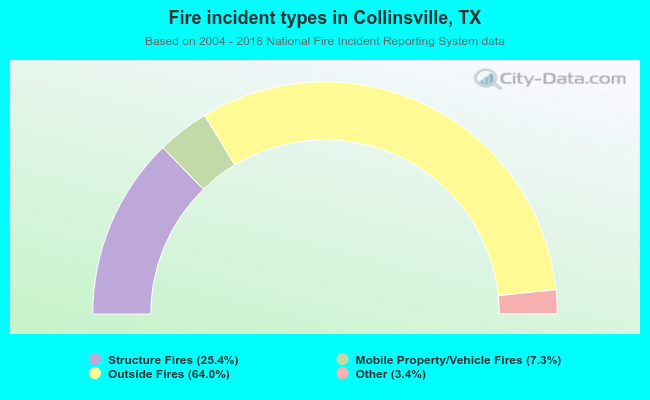 When looking into fire subcategories, the most reports belonged to: Outside Fires (64.0%), and Structure Fires (25.4%).