Chicago: Fire Incidents, Illinois (IL)
Where are fire incidents reported in Chicago, IL
Something went wrong! Please refresh the page.
| Fire incidents reported | |
|---|---|
| Sreet name | Count |
| MICHIGAN AVE | 2,300 |
| SHERIDAN RD | 2,028 |
| WABASH AVE | 2,016 |
| ASHLAND AVE | 1,736 |
| 47TH ST | 1,650 |
| DR MARTIN LUTHER KING JR DR | 1,590 |
| DAMEN AVE | 1,514 |
| KEDZIE AVE | 1,494 |
| CLARK ST | 1,450 |
| WESTERN AVE | 1,424 |
| HALSTED ST | 1,420 |
| MADISON ST | 1,416 |
| STATE ST | 1,406 |
| PULASKI RD | 1,350 |
| INDIANA AVE | 1,302 |
| CICERO AVE | 1,216 |
| CHICAGO AVE | 1,178 |
| CALIFORNIA AVE | 1,124 |
| PAULINA ST | 1,096 |
| WELLS ST | 1,094 |
| CENTRAL AVE | 1,060 |
| NORTH AVE | 1,040 |
| PETERSON AVE | 1,028 |
| RACINE AVE | 1,026 |
| 79TH ST | 1,016 |
| COTTAGE GROVE AVE | 1,016 |
| LAKE SHORE DR | 988 |
| MONROE ST | 980 |
| LAWNDALE AVE | 968 |
| MARSHFIELD AVE | 938 |
| Other | 81,669 |
2009 - 2018 National Fire Incident Reporting System (NFIRS) incidents
- Incident types reported to NFIRS in Chicago, IL
- 847,80364.6%Rescue & EMS
- 121,5339.3%Fire
- 113,4848.7%Hazardous Condition
- 91,7387.0%False Alarm
- 88,6906.8%Service Call
- 43,7343.3%Good Intent Call
- 3,4570.3%Special Incident
- Fire incident types reported to NFIRS in Chicago, IL
- 65,05553.5%Structure Fires
- 24,78020.4%Outside Fires
- 21,73017.9%Mobile Property/Vehicle Fires
- 9,9688.2%Other
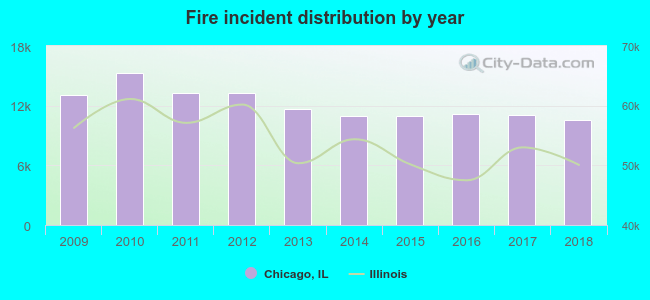 According to the data from the years 2009 - 2018 the average number of fire incidents per year is 12,147. The highest number of fire incidents - 15,319 took place in 2010, and the least - 10,581 in 2018. The data has a declining trend.
The average number of yearly fire incidents per 10k residents in Chicago, IL compared to nearest cities:
(Note: Based on data for the last 3 years, including only cities with population 5,000 and above)
| Chicago: | 40.2 |
| Cicero: | 25.7 |
| Berwyn: | 23.0 |
| Stickney: | 48.4 |
| Oak Park: | 26.3 |
| Riverside: | 20.6 |
| Forest Park: | 45.8 |
| Lyons: | 67.8 |
| North Riverside: | 31.4 |
 The median response time based on all reported fire incidents is 4 minutes. This is lower than the state median value.
The median response time in Chicago, IL compared to nearest cities:
(Note: Based on data for all years, including only cities with at least 500 fire incidents)
| Chicago: | 4 minutes |
| Cicero: | 3 minutes |
| Berwyn: | 3 minutes |
| Stickney: | 5 minutes |
| Oak Park: | 5 minutes |
| Riverside: | 6 minutes |
| Forest Park: | 5 minutes |
| Bedford Park: | 5 minutes |
| Lyons: | 5 minutes |
 According to the data from the years 2009 - 2018 the average number of fire-related fatalities per year is 25. The highest number of deaths - 36 took place in 2009, and the lowest - 16 in 2010. The data has a decreasing trend.
The average number of deaths per 1,000 fires is 2. This indicator was the highest - 3 in 2018, and the lowest 1 in 2010. The trend for deaths per 1,000 incidents is increasing. Compared to the Illinois value the number of deaths per 1,000 fire incidents is similar.
According to the data from the years 2009 - 2018 the average number of fire-related fatalities per year is 25. The highest number of deaths - 36 took place in 2009, and the lowest - 16 in 2010. The data has a decreasing trend.
The average number of deaths per 1,000 fires is 2. This indicator was the highest - 3 in 2018, and the lowest 1 in 2010. The trend for deaths per 1,000 incidents is increasing. Compared to the Illinois value the number of deaths per 1,000 fire incidents is similar.
 According to the data from the years 2009 - 2018 the average number of fire-related casualties per year is 118. The highest number of reported casualties - 144 took place in 2011, and the lowest - 86 in 2013. The data has a growing trend.
The average number of injuries per 1,000 fire incidents is 10. This indicator was the highest - 13 in 2018, and the lowest 7 in 2013. The trend for injuries per 1,000 incidents is growing. Compared to the state value the number of injuries per 1,000 fire incidents is similar.
According to the data from the years 2009 - 2018 the average number of fire-related casualties per year is 118. The highest number of reported casualties - 144 took place in 2011, and the lowest - 86 in 2013. The data has a growing trend.
The average number of injuries per 1,000 fire incidents is 10. This indicator was the highest - 13 in 2018, and the lowest 7 in 2013. The trend for injuries per 1,000 incidents is growing. Compared to the state value the number of injuries per 1,000 fire incidents is similar.Casualties per 1,000 incidents in Chicago, IL compared to nearest cities:
(Note: Based on data for all years, including only cities with at least 500 fire incidents)
| Chicago: | 9.7 |
| Cicero: | 13.7 |
| Berwyn: | 15.9 |
| Stickney: | 8.8 |
| Oak Park: | 11.2 |
| Riverside: | 11.7 |
| Forest Park: | 8.3 |
| Bedford Park: | 4.4 |
| Lyons: | 15.7 |
 36.6% incidents where reported in the morning and 63.4% in the evening. The most fires (16.5%) took place on Sunday, and the least (13.2%) on Thursday.
 According to the 121,533 reports from years 2009 - 2018 most fires (12.0%) took place during July, and the least (6.2%) in February.
 Out of all 1,311,722 cases reported during the years 2009 - 2018, the most belonged to the categories: Rescue & EMS (64.6%), Fire (9.3%), and Hazardous Condition (8.7%).
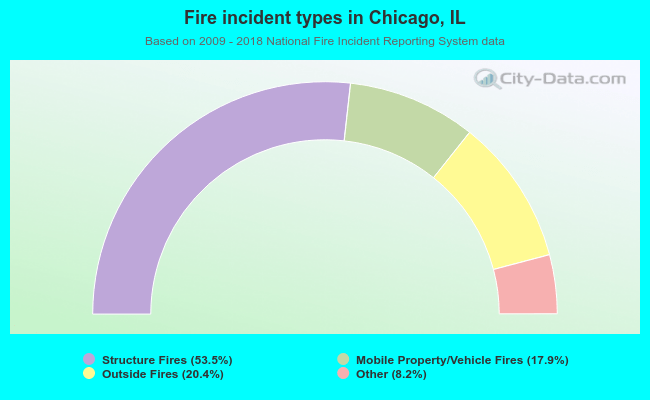 When looking into fire subcategories, the most incidents belonged to: Structure Fires (53.5%), and Outside Fires (20.4%).