Champaign: Fire Incidents, Illinois (IL)
Where are fire incidents reported in Champaign, IL
Something went wrong! Please refresh the page.
| Fire incidents reported | |
|---|---|
| Sreet name | Count |
| JOHN ST | 522 |
| NEIL ST | 390 |
| SPRINGFIELD AVE | 366 |
| GREEN ST | 296 |
| MATTIS AVE | 272 |
| FIRST ST | 250 |
| PROSPECT AVE | 248 |
| CHALMERS ST | 214 |
| BRADLEY AVE | 210 |
| WHITE ST | 192 |
| ARMORY AVE | 188 |
| FOURTH ST | 184 |
| DANIEL ST | 156 |
| CHURCH ST | 150 |
| KIRBY AVE | 148 |
| THIRD ST | 142 |
| HEALEY ST | 130 |
| WASHINGTON ST | 116 |
| SECOND ST | 114 |
| UNIVERSITY AVE | 112 |
| CRESCENT DR | 106 |
| CLARK ST | 104 |
| OAK ST | 104 |
| MORELAND BLVD | 100 |
| STOUGHTON ST | 96 |
| WRIGHT ST | 90 |
| ANTHONY DR | 86 |
| FIFTH ST | 84 |
| BEARDSLEY AVE | 82 |
| MARKET ST | 82 |
2002 - 2018 National Fire Incident Reporting System (NFIRS) incidents
- Incident types reported to NFIRS in Champaign, IL
- 26,54548.8%Rescue & EMS
- 8,65915.9%False Alarm
- 5,79110.6%Hazardous Condition
- 5,1639.5%Fire
- 4,2037.7%Service Call
- 3,8297.0%Good Intent Call
- 1520.3%Overpressure Rupture
- Fire incident types reported to NFIRS in Champaign, IL
- 2,10940.8%Structure Fires
- 2,01038.9%Outside Fires
- 67013.0%Mobile Property/Vehicle Fires
- 3747.2%Other
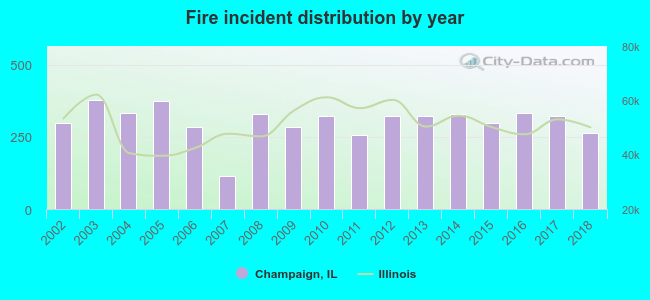 According to the data from the years 2002 - 2018 the average number of fires per year is 304. The highest number of reported fire incidents - 377 took place in 2003, and the least - 113 in 2007. The data has a dropping trend.
 The median response time based on all reported fire incidents is 5 minutes. This is similar to the state median value.
The median response time in Champaign, IL compared to nearest cities:
(Note: Based on data for all years, including only cities with at least 500 fire incidents)
| Champaign: | 5 minutes |
| Urbana: | 5 minutes |
| Savoy: | 7 minutes |
| Mahomet: | 9 minutes |
| Rantoul: | 5 minutes |
| Westville: | 10 minutes |
| Danville: | 5 minutes |
| Georgetown: | 10 minutes |
 According to the data from the years 2002 - 2018 the average number of fire-related fatalities per year is 0. The highest number of deaths - 2 took place in 2013, and the lowest - 0 in 2004. The data has a decreasing trend.
The average number of fatalities per 1,000 fires is 1. This indicator was the highest - 6 in 2013, and the lowest 0 in 2004. The trend for deaths per 1,000 fire incidents is dropping. Compared to the state value the number of fatalities per 1,000 incidents is lower.
According to the data from the years 2002 - 2018 the average number of fire-related fatalities per year is 0. The highest number of deaths - 2 took place in 2013, and the lowest - 0 in 2004. The data has a decreasing trend.
The average number of fatalities per 1,000 fires is 1. This indicator was the highest - 6 in 2013, and the lowest 0 in 2004. The trend for deaths per 1,000 fire incidents is dropping. Compared to the state value the number of fatalities per 1,000 incidents is lower.
 According to the reports from the years 2002 - 2018 the average number of fire-related casualties per year is 4. The highest number of casualties - 14 took place in 2006, and the lowest - 0 in 2014. The data has a decreasing trend.
The average number of injuries per 1,000 fire incidents is 12. This indicator was the highest - 49 in 2006, and the lowest 0 in 2014. The trend for casualties per 1,000 fire incidents is dropping. Compared to the state value the number of casualties per 1,000 fires is about the same.
According to the reports from the years 2002 - 2018 the average number of fire-related casualties per year is 4. The highest number of casualties - 14 took place in 2006, and the lowest - 0 in 2014. The data has a decreasing trend.
The average number of injuries per 1,000 fire incidents is 12. This indicator was the highest - 49 in 2006, and the lowest 0 in 2014. The trend for casualties per 1,000 fire incidents is dropping. Compared to the state value the number of casualties per 1,000 fires is about the same.
 35.4% incidents where reported in the morning and 64.6% in the evening. The most fires (16.1%) took place on Saturday, and the least (12.7%) on Tuesday.
 According to the 5,163 fire incident reports from years 2002 - 2018 most fires (10.6%) took place during April, and the least (6.0%) in January.
 Out of all 54,418 cases reported during the years 2002 - 2018, the most belonged to the categories: Rescue & EMS (48.8%), False Alarm (15.9%), and Hazardous Condition (10.6%).
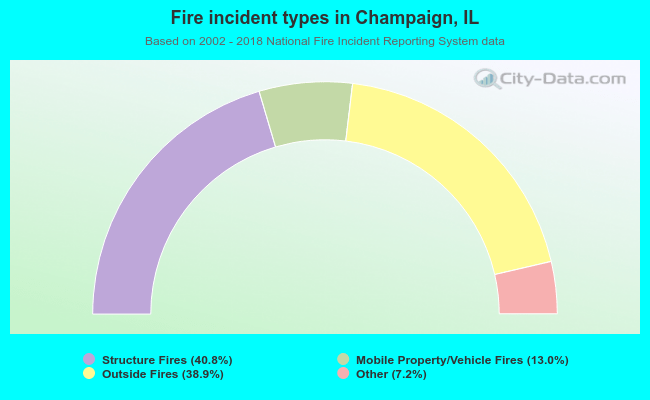 When looking into fire subcategories, the most reports belonged to: Structure Fires (40.8%), and Outside Fires (38.9%).