Caruthersville: Fire Incidents, Missouri (MO)
Where are fire incidents reported in Caruthersville, MO
Something went wrong! Please refresh the page.
|
| |||||||||||||||||||||||||||||||||||||||||||||||||||||||||||||||||||||||||||||||||||||||||||||||||||||||||||||
| Other | 156 | |||||||||||||||||||||||||||||||||||||||||||||||||||||||||||||||||||||||||||||||||||||||||||||||||||||||||||||
2002 - 2018 National Fire Incident Reporting System (NFIRS) incidents
- Incident types reported to NFIRS in Caruthersville, MO
- 90468.8%Fire
- 17713.5%Hazardous Condition
- 1068.1%Good Intent Call
- 937.1%False Alarm
- 272.1%Rescue & EMS
- 60.5%Service Call
- Fire incident types reported to NFIRS in Caruthersville, MO
- 37641.6%Structure Fires
- 32836.3%Outside Fires
- 19521.6%Mobile Property/Vehicle Fires
- 50.6%Other
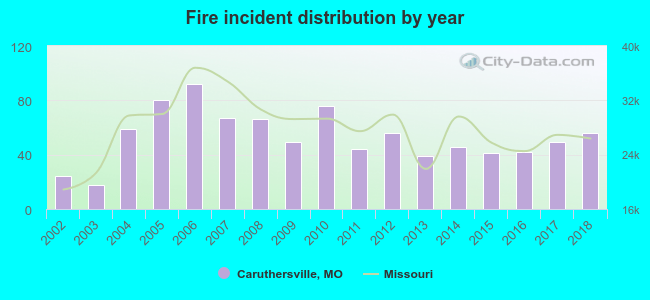 According to the data from the years 2002 - 2018 the average number of fires per year is 53. The highest number of reported fire incidents - 92 took place in 2006, and the least - 18 in 2003. The data has a growing trend.
The average number of yearly fire incidents per 10k residents in Caruthersville, MO compared to nearest cities:
(Note: Based on data for the last 3 years, including only cities with population 5,000 and above)
| Caruthersville: | 82.0 |
| Kennett: | 88.3 |
 The median response time based on all reported fire incidents is 3 minutes. This is much lower compared to the state median value.
The median response time in Caruthersville, MO compared to nearest cities:
(Note: Based on data for all years, including only cities with at least 500 fire incidents)
| Caruthersville: | 3 minutes |
| Portageville: | 9 minutes |
| Kennett: | 3 minutes |
| Blytheville: | 4 minutes |
| Malden: | 4 minutes |
| Rector: | 7 minutes |
| Osceola: | 3 minutes |
 33.2% incidents where reported in the morning and 66.8% in the evening. The most fires (16.2%) took place on Saturday, and the least (12.8%) on Wednesday.
 Based on the 904 incident reports from years 2002 - 2018 most fires (14.0%) took place during July, and the least (6.1%) in February.
 Out of all 1,314 cases reported during the years 2002 - 2018, the most belonged to the categories: Fire (68.8%), Hazardous Condition (13.5%), and Good Intent Call (8.1%).
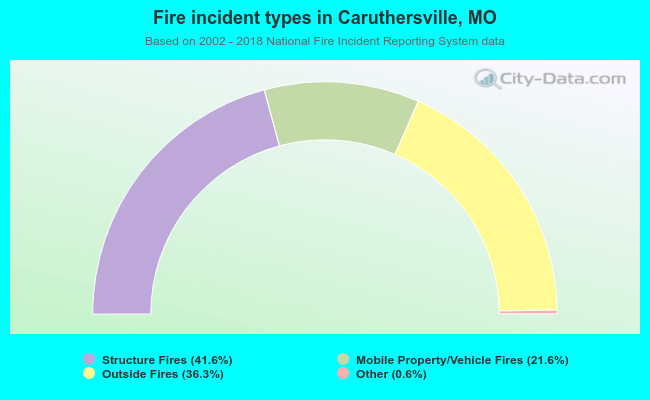 When looking into fire subcategories, the most reports belonged to: Structure Fires (41.6%), and Outside Fires (36.3%).