Butler: Fire Incidents, Pennsylvania (PA)
Where are fire incidents reported in Butler, PA
Something went wrong! Please refresh the page.
| Fire incidents reported | |
|---|---|
| Sreet name | Count |
| MAIN ST | 92 |
| JEFFERSON ST | 66 |
| BRADY ST | 64 |
| CUNNINGHAM ST | 42 |
| WASHINGTON ST | 30 |
| CENTER AVE | 28 |
| HERMAN RD | 28 |
| PITTSBURGH RD | 28 |
| EVANS CITY RD | 26 |
| MCKEAN ST | 26 |
| PENN ST | 26 |
| MONROE ST | 24 |
| NEW CASTLE ST | 24 |
| NORTH ST | 24 |
| FREEPORT RD | 22 |
| NEW CASTLE RD | 22 |
| DINNERBELL RD | 18 |
| PEARL ST | 18 |
| CLIFF ST | 16 |
| KAUFMAN DR | 16 |
| BONNIEBROOK | 14 |
| DIAMOND ST | 14 |
| ELM ST | 14 |
| LINCOLN AVE | 14 |
| SECOND ST | 14 |
| VIRGINIA AVE | 14 |
| WAYNE ST | 14 |
| ZEIGLER AVE | 14 |
| FIRST ST | 12 |
| KITTANNING ST | 12 |
| Other | 226 |
2003 - 2018 National Fire Incident Reporting System (NFIRS) incidents
- Incident types reported to NFIRS in Butler, PA
- 9,93265.8%Rescue & EMS
- 1,4279.5%Service Call
- 1,3098.7%False Alarm
- 1,0236.8%Hazardous Condition
- 1,0026.6%Fire
- 3402.3%Good Intent Call
- 300.2%Severe Weather
- 160.1%Special Incident
- Fire incident types reported to NFIRS in Butler, PA
- 51751.6%Structure Fires
- 22922.9%Outside Fires
- 16816.8%Other
- 888.8%Mobile Property/Vehicle Fires
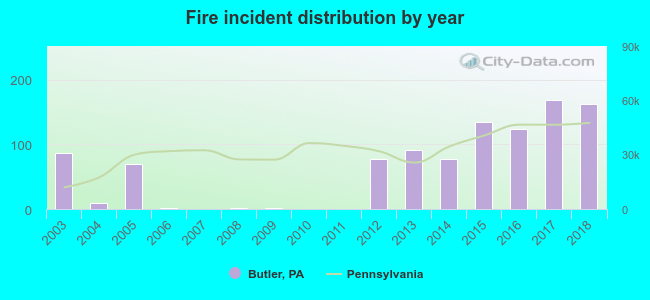 According to the data from the years 2003 - 2018 the average number of fire incidents per year is 63. The highest number of fires - 168 took place in 2017, and the least - 0 in 2007. The data has an increasing trend.
The average number of yearly fire incidents per 10k residents in Butler, PA compared to nearest cities:
(Note: Based on data for the last 3 years, including only cities with population 5,000 and above)
| Butler: | 113.2 |
| Ellwood City: | 48.2 |
| Arnold: | 10.0 |
| Allison Park: | 14.2 |
| Lower Burrell: | 11.6 |
| Franklin Park: | 0.9 |
| New Kensington: | 29.2 |
| Economy: | 2.2 |
| Glenshaw: | 2.6 |
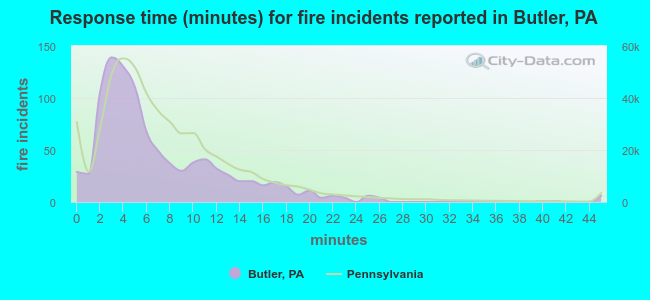 The median response time based on all reported fire incidents is 5 minutes. This is lower compared to the state median value.
The median response time in Butler, PA compared to nearest cities:
(Note: Based on data for all years, including only cities with at least 500 fire incidents)
| Butler: | 5 minutes |
| Gibsonia: | 9 minutes |
| Kittanning: | 6 minutes |
| New Kensington: | 6 minutes |
| Leechburg: | 9 minutes |
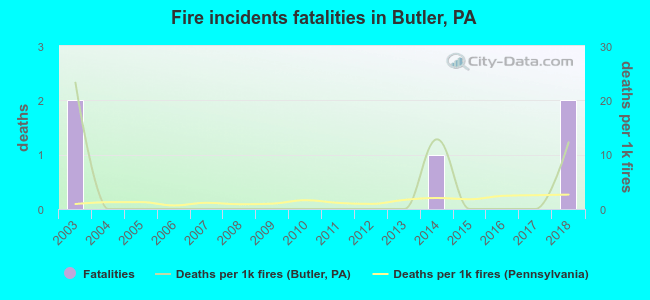 According to the data from the years 2003 - 2018 the average number of fire-related yearly deaths is 0. The highest number of deaths - 2 took place in 2003, and the lowest - 0 in 2004. The data has a constant trend.
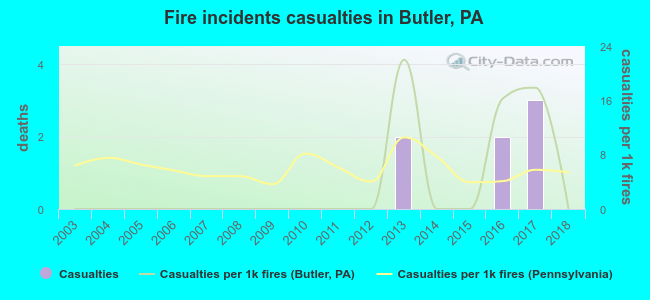 According to the data from the years 2003 - 2018 the average number of fire-related yearly casualties is 0. The highest number of reported injuries - 3 took place in 2017, and the lowest - 0 in 2003. The data has a constant trend.
The average number of injuries per 1,000 fires is 4. This indicator was the highest - 22 in 2013, and the lowest 0 in 2003. The trend for casualties per 1,000 incidents is constant. Compared to the state value the number of injuries per 1,000 fire incidents is higher.
According to the data from the years 2003 - 2018 the average number of fire-related yearly casualties is 0. The highest number of reported injuries - 3 took place in 2017, and the lowest - 0 in 2003. The data has a constant trend.
The average number of injuries per 1,000 fires is 4. This indicator was the highest - 22 in 2013, and the lowest 0 in 2003. The trend for casualties per 1,000 incidents is constant. Compared to the state value the number of injuries per 1,000 fire incidents is higher.Casualties per 1,000 incidents in Butler, PA compared to nearest cities:
(Note: Based on data for all years, including only cities with at least 500 fire incidents)
| Butler: | 7.0 |
| Gibsonia: | 9.4 |
| Kittanning: | 0.0 |
| New Kensington: | 1.6 |
| Leechburg: | 0.0 |
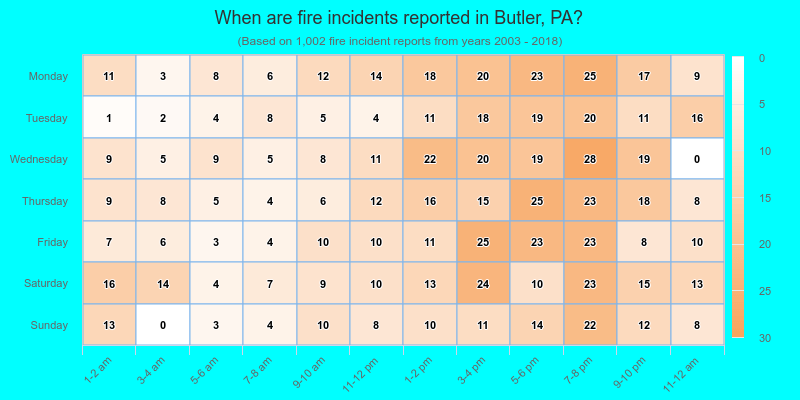
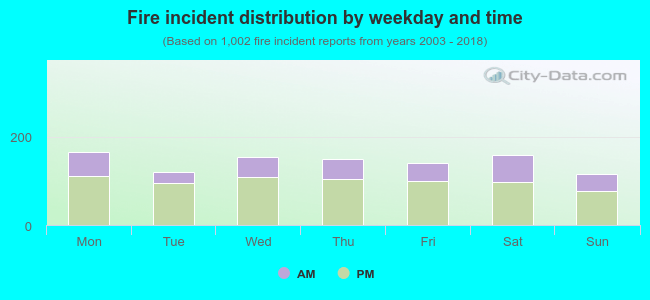 30.6% incidents where reported in the morning and 69.4% in the evening. The most fires (16.6%) took place on Monday, and the least (11.5%) on Sunday.
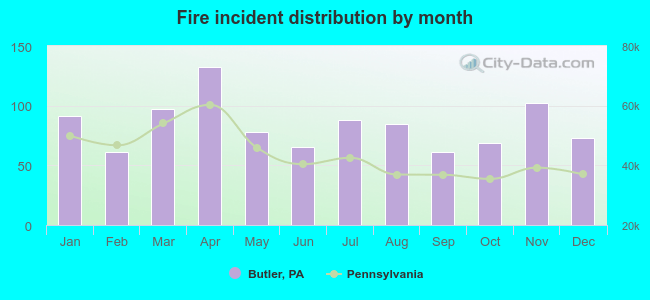 According to the 1,002 reports from years 2003 - 2018 most fires (13.2%) took place during April, and the least (6.1%) in February.
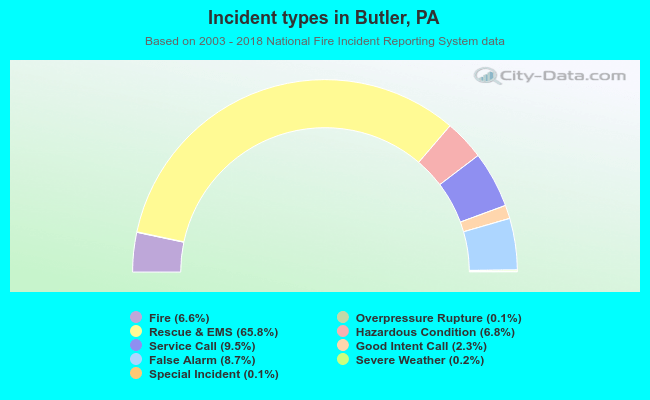 Out of all 15,088 cases reported during the years 2003 - 2018, the most belonged to the categories: Rescue & EMS (65.8%), Service Call (9.5%), and False Alarm (8.7%).
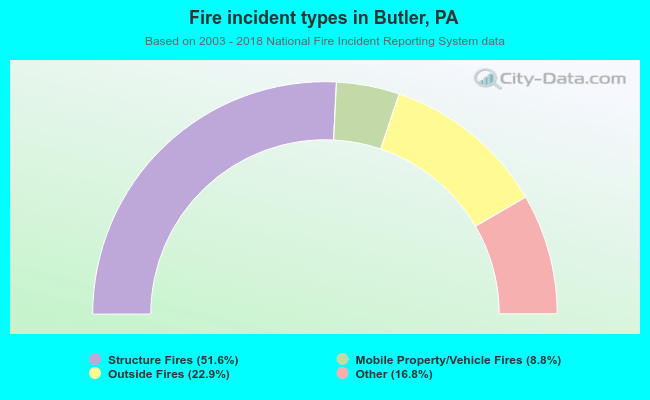 When looking into fire subcategories, the most reports belonged to: Structure Fires (51.6%), and Outside Fires (22.9%).