Box Elder: Fire Incidents, South Dakota (SD)
Where are fire incidents reported in Box Elder, SD
Something went wrong! Please refresh the page.
|
| |||||||||||||||||||||||||||||||||||||||||||||||||||||||||||||||||||||||||||||||||||||||||||||||||||||||||||||
| Other | 146 | |||||||||||||||||||||||||||||||||||||||||||||||||||||||||||||||||||||||||||||||||||||||||||||||||||||||||||||
2002 - 2018 National Fire Incident Reporting System (NFIRS) incidents
- Incident types reported to NFIRS in Box Elder, SD
- 3,04869.6%Rescue & EMS
- 49411.3%Fire
- 45310.3%Good Intent Call
- 2295.2%False Alarm
- 841.9%Hazardous Condition
- 661.5%Service Call
- Fire incident types reported to NFIRS in Box Elder, SD
- 17836.0%Outside Fires
- 15130.6%Structure Fires
- 15130.6%Other
- 142.8%Mobile Property/Vehicle Fires
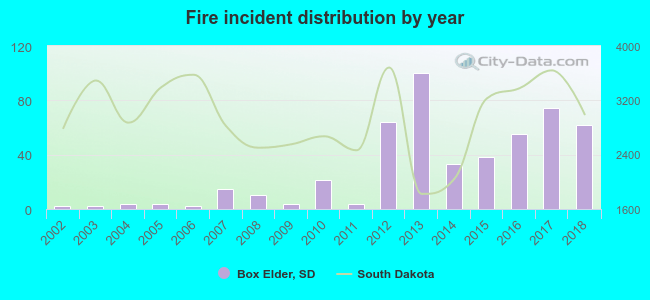 According to the data from the years 2002 - 2018 the average number of fire incidents per year is 29. The highest number of reported fires - 100 took place in 2013, and the least - 2 in 2002. The data has a growing trend.
The average number of yearly fire incidents per 10k residents in Box Elder, SD compared to nearest cities:
(Note: Based on data for the last 3 years, including only cities with population 5,000 and above)
| Box Elder: | 69.0 |
| Rapid Valley: | 16.9 |
| Rapid City: | 48.9 |
| Sturgis: | 61.3 |
| Spearfish: | 31.3 |
| Belle Fourche: | 9.9 |
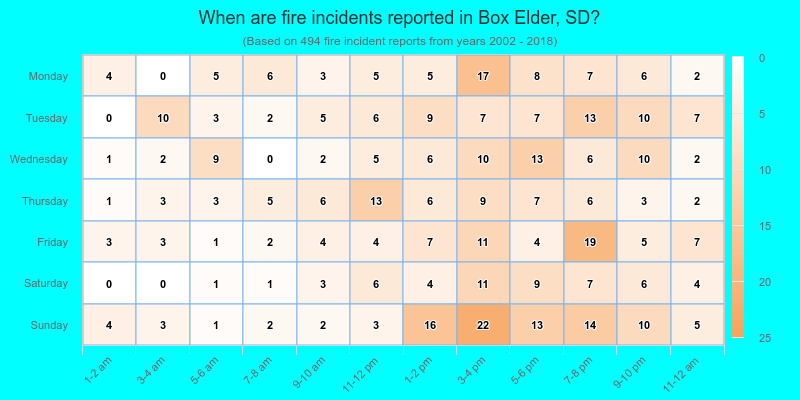
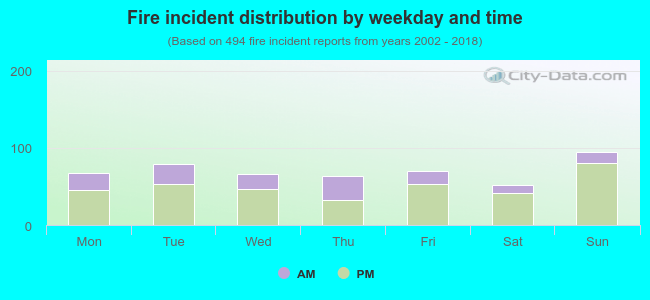 28.7% incidents where reported in the morning and 71.3% in the evening. The most fires (19.2%) took place on Sunday, and the least (10.5%) on Saturday.
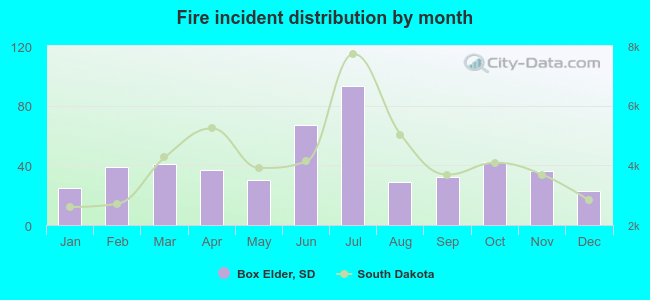 According to the 494 reports from years 2002 - 2018 most fires (18.8%) took place during July, and the least (4.7%) in December.
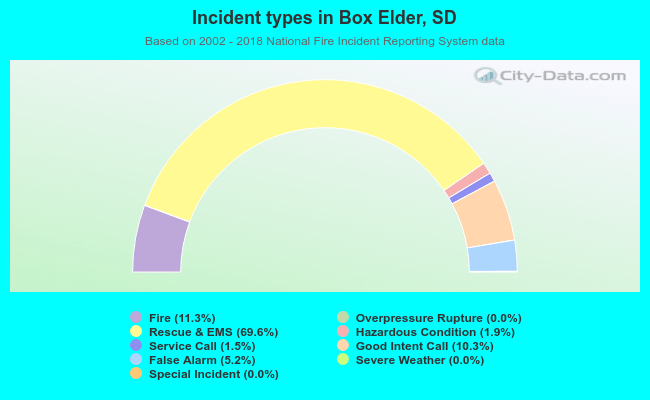 Out of all 4,380 cases reported during the years 2002 - 2018, the most belonged to the categories: Rescue & EMS (69.6%), Fire (11.3%), and Good Intent Call (10.3%).
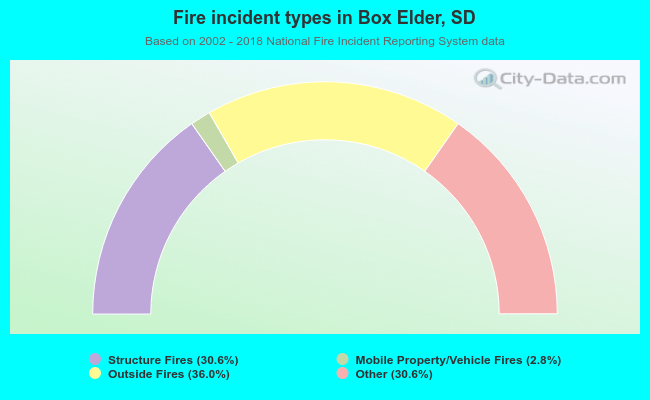 When looking into fire subcategories, the most reports belonged to: Outside Fires (36.0%), and Structure Fires (30.6%).