| Fire incidents reported |
|---|
| Sreet name | Count |
|---|
| US HWY 287 | 34 | | US 287 HWY | 20 | | FM 1288 | 16 | | FRANKLIN ST | 14 | | BETZ ST | 10 | | SEVENTH ST | 10 | | FM 174 | 8 | | FOURTH ST | 8 | | ROSS ST | 8 | | FM 1288 SOUTH | 6 | | STUDDARD RD | 6 | | US 287 | 6 | | CLAY ST | 4 | | COLE ST | 4 | | DUTTON RD | 4 | | FIFTH ST | 4 | | FM 174 HWY | 4 | | GIFFORD RD | 4 | | HWY 287 | 4 | | HWY 287 SOUTH | 4 | | LONESTAR RD | 4 | | MANTON RD | 4 | | MANTON ROAD | 4 | | MCDONALD ROAD | 4 | | POWELL RD | 4 |
| | | Fire incidents reported |
|---|
| Sreet name | Count |
|---|
| STUDDARD RD | 4 | | THIRD ST | 4 | | 1288 | 2 | | 1288 AND HWY 59 HWY | 2 | | 1288 S. | 2 | | 133 4TH ST. | 2 | | 148 @ CLAY CO | 2 | | 148 SOUTH | 2 | | 1869 FEED RD | 2 | | 2094 FM 1288 SOUTH | 2 | | 220 CLAY STREET | 2 | | 2204 BIG SANDY RD. | 2 | | 287 & WYNN GREY | 2 | | 287 / WIND GRAY-BELLEVUE | 2 | | 2ND ST | 2 | | 3 RD ST | 2 | | 3/4 MILE S OF FM 2321 & | 2 | | 338 LIGGETT RD | 2 | | 343 PRARIE BRANCH RD | 2 | | 3612 BUFFALO SPRINGS RD | 2 | | 4 TH AND REX DAVIS RD | 2 | | 4 WIRE RD RD | 2 | | 4000 GOWAN RD. | 2 | | 415 4TH ST. | 2 | | |
|
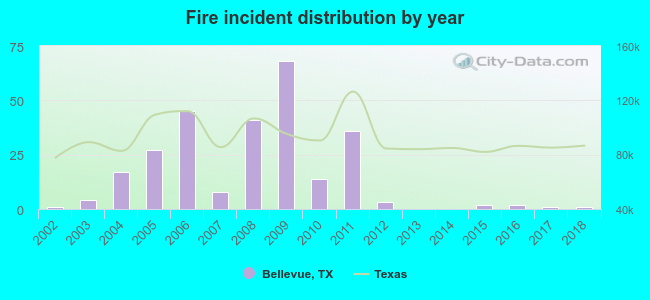 According to the data from the years 2002 - 2018 the average number of fire incidents per year is 16. The highest number of reported fire incidents - 68 took place in 2009, and the least - 0 in 2013. The data has a constant trend.
 31.5% incidents where reported in the morning and 68.5% in the evening. The most fires (21.1%) took place on Sunday, and the least (11.5%) on Friday.
 According to the 270 reports from years 2002 - 2018 most fires (11.9%) took place during March, and the least (3.3%) in December.
 Out of all 333 cases reported during the years 2002 - 2018, the most belonged to the categories: Fire (81.1%), Rescue & EMS (8.4%), and Service Call (6.9%).
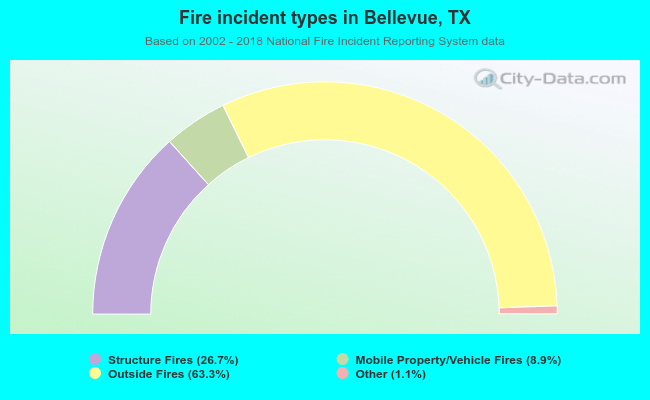 When looking into fire subcategories, the most incidents belonged to: Outside Fires (63.3%), and Structure Fires (26.7%).