| Fire incidents reported |
|---|
| Sreet name | Count |
|---|
| AUTRY RD | 10 | | 127 VEGA ROAD | 6 | | 136 | 6 | | 180 AUTRY RD. | 6 | | 2678 | 6 | | FM136 | 6 | | HWY 136 | 6 | | HWY 136 2678 | 6 | | AUTRY RD. | 4 | | CR 640 | 4 | | FM 136 | 4 | | FM1360 | 4 | | GIN RD | 4 | | HIGHWAY 136 | 4 | | RANCHO GRANDE | 4 | | VEGA RD | 4 | | VEGA RD. | 4 | | ! MILE NORTH OF BAYSIDE | 2 | | (CLUB HOUSE) GIN RD | 2 | | 1 MILE NORTH OF BAYSIDE | 2 | | 1 ST | 2 | | 1/2 MILE AYTRY RD. | 2 | | 1/2 MILE SOUTH OF BAYSIDE | 2 | | 1015 2ND STREET | 2 | | 1111 SECOND ST. | 2 |
| | | Fire incidents reported |
|---|
| Sreet name | Count |
|---|
| 115 RANCHO GRANDE | 2 | | 119 WEST RANCH RD | 2 | | 125 VEGA RD. | 2 | | 1300 3RD ST | 2 | | 1311 SECOND ST | 2 | | 1312 3RD ST. | 2 | | 135 FIRST ST. | 2 | | 136 | 2 | | 136 & FRICKS RD. | 2 | | 136 (COTTON GIN) | 2 | | 136 2678 | 2 | | 136 BRIDGE | 2 | | 136 HWY | 2 | | 136( BEHIND FIRE STATION) | 2 | | 1360 | 2 | | 1360 / GIN ROAD | 2 | | 1360 AND GIN ROAD | 2 | | 139 MULLEN BAYOU | 2 | | 1467 FM 136 | 2 | | 150 VEGA RD. | 2 | | 2178 ( 7 MILES NORTH ) | 2 | | 2224 LEVIEN RD | 2 | | 2400 BLK 1ST ST. | 2 | | 265 RANCHO GRANDO RD | 2 | | |
|
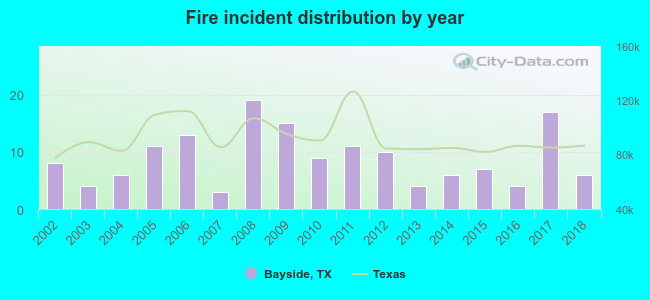 Based on the data from the years 2002 - 2018 the average number of fire incidents per year is 9. The highest number of fires - 19 took place in 2008, and the least - 3 in 2007. The data has a decreasing trend.
 34.0% incidents where reported in the morning and 66.0% in the evening. The most fires (24.2%) took place on Sunday, and the least (6.5%) on Thursday.
 According to the 153 fire incidents from years 2002 - 2018 most fires (13.1%) took place during October, and the least (3.3%) in December.
 Out of all 372 cases reported during the years 2002 - 2018, the most belonged to the categories: Fire (41.1%), Rescue & EMS (36.8%), and Hazardous Condition (10.2%).
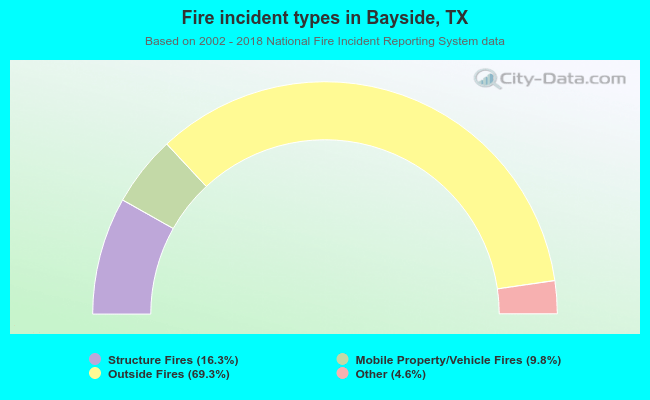 When looking into fire subcategories, the most reports belonged to: Outside Fires (69.3%), and Structure Fires (16.3%).