Barling: Fire Incidents, Arkansas (AR)
Where are fire incidents reported in Barling, AR
Something went wrong! Please refresh the page.
|
| |||||||||||||||||||||||||||||||||||||||||||||||||||||||||||||||||||||||||||||||||||||||||||||||||||||||||||||
2003 - 2018 National Fire Incident Reporting System (NFIRS) incidents
- Incident types reported to NFIRS in Barling, AR
- 2,62076.2%Rescue & EMS
- 42912.5%Fire
- 1394.0%Good Intent Call
- 1233.6%Service Call
- 942.7%Hazardous Condition
- 280.8%False Alarm
- 40.1%Severe Weather
- Fire incident types reported to NFIRS in Barling, AR
- 23053.6%Structure Fires
- 14032.6%Outside Fires
- 409.3%Mobile Property/Vehicle Fires
- 194.4%Other
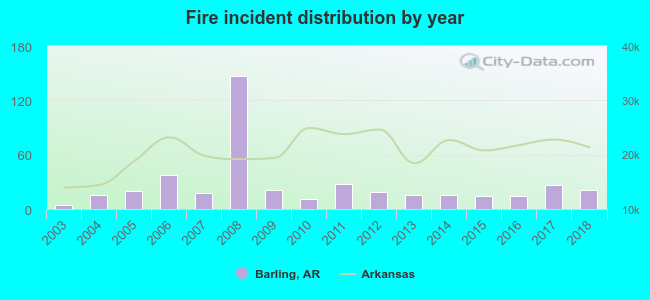 According to the data from the years 2003 - 2018 the average number of fire incidents per year is 27. The highest number of reported fire incidents - 147 took place in 2008, and the least - 4 in 2003. The data has an increasing trend.
 47.8% incidents where reported in the morning and 52.2% in the evening. The most fires (38.9%) took place on Tuesday, and the least (8.4%) on Monday.
 Based on the 429 fire incidents from years 2003 - 2018 most fires (38.7%) took place during January, and the least (3.3%) in June.
 Out of all 3,437 cases reported during the years 2003 - 2018, the most belonged to the categories: Overpressure Rupture (76.2%), Fire (12.5%), and Service Call (4.0%).
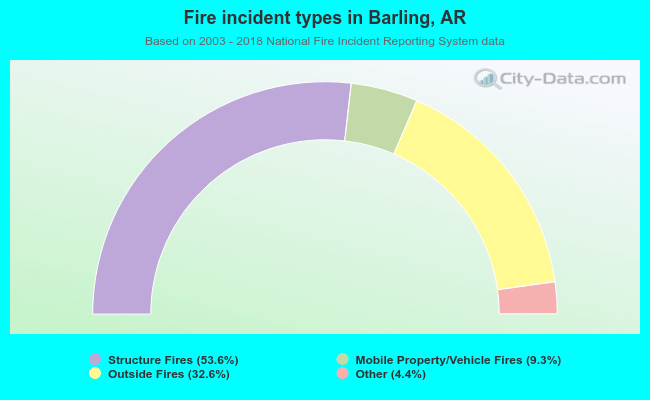 When looking into fire subcategories, the most incidents belonged to: Structure Fires (53.6%), and Outside Fires (32.6%).