Bainbridge: Fire Incidents, New York (NY)
Where are fire incidents reported in Bainbridge, NY
Something went wrong! Please refresh the page.
|
| |||||||||||||||||||||||||||||||||||||||||||||||||||||||||||||||||||||||||||||||||||||||||||||||||||||||||||||
2002 - 2018 National Fire Incident Reporting System (NFIRS) incidents
- Incident types reported to NFIRS in Bainbridge, NY
- 1,13756.2%Rescue & EMS
- 35417.5%Hazardous Condition
- 33116.4%Fire
- 1105.4%Good Intent Call
- 442.2%Service Call
- 371.8%False Alarm
- 80.4%Severe Weather
- 30.1%Special Incident
- Fire incident types reported to NFIRS in Bainbridge, NY
- 17753.5%Structure Fires
- 5917.8%Outside Fires
- 5817.5%Other
- 3711.2%Mobile Property/Vehicle Fires
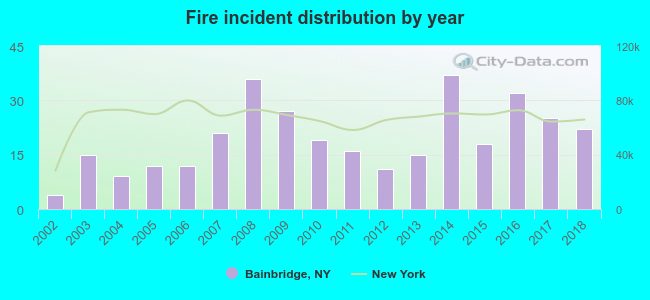 According to the data from the years 2002 - 2018 the average number of fires per year is 19. The highest number of reported fires - 37 took place in 2014, and the least - 4 in 2002. The data has a growing trend.
 30.2% incidents where reported in the morning and 69.8% in the evening. The most fires (16.9%) took place on Wednesday, and the least (9.1%) on Thursday.
 According to the 331 fires from years 2002 - 2018 most fires (14.2%) took place during April, and the least (3.3%) in June.
 Out of all 2,024 cases reported during the years 2002 - 2018, the most belonged to the categories: Overpressure Rupture (56.2%), Rescue & EMS (17.5%), and Fire (16.4%).
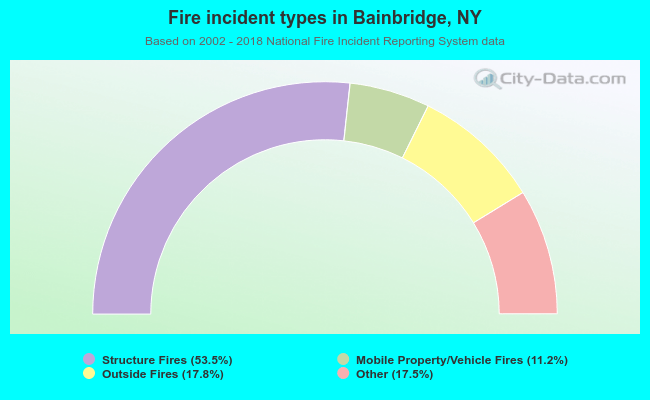 When looking into fire subcategories, the most incidents belonged to: Structure Fires (53.5%), and Outside Fires (17.8%).