Athens: Fire Incidents, Ohio (OH)
Where are fire incidents reported in Athens, OH
Something went wrong! Please refresh the page.
| Fire incidents reported | |
|---|---|
| Sreet name | Count |
| STATE ST | 314 |
| COURT ST | 190 |
| GREEN DR | 184 |
| MILL ST | 162 |
| MCKINLEY AVE | 132 |
| UNION ST | 116 |
| RICHLAND AVE | 110 |
| CONGRESS ST | 92 |
| PALMER ST | 80 |
| SHAFER ST | 68 |
| COLLEGE ST | 54 |
| STATE ROUTE 33 HWY | 54 |
| WASHINGTON ST | 48 |
| VORE RIDGE RD | 44 |
| COLUMBUS RD | 40 |
| CARRIAGE HILL DR | 38 |
| PLEASANT HILL RD | 38 |
| HIGH ST | 36 |
| STIMSON AVE | 36 |
| CARPENTER ST | 30 |
| HOCKING ST | 30 |
| LONG RUN RD | 30 |
| FISHER RD | 28 |
| LANCASTER ST | 28 |
| OAK ST | 28 |
| OLD US RT 33 | 28 |
| SALEM RD | 26 |
| UNIVERSITY TER | 26 |
| PLEASANTON RD | 24 |
| RADFORD RD | 24 |
| Other | 63 |
2002 - 2018 National Fire Incident Reporting System (NFIRS) incidents
- Incident types reported to NFIRS in Athens, OH
- 3,36031.7%Hazardous Condition
- 2,97728.1%False Alarm
- 2,20120.8%Fire
- 7997.5%Good Intent Call
- 7567.1%Rescue & EMS
- 4083.9%Service Call
- 450.4%Overpressure Rupture
- 260.2%Severe Weather
- 150.1%Special Incident
- Fire incident types reported to NFIRS in Athens, OH
- 98244.6%Outside Fires
- 88140.0%Structure Fires
- 31814.4%Mobile Property/Vehicle Fires
- 200.9%Other
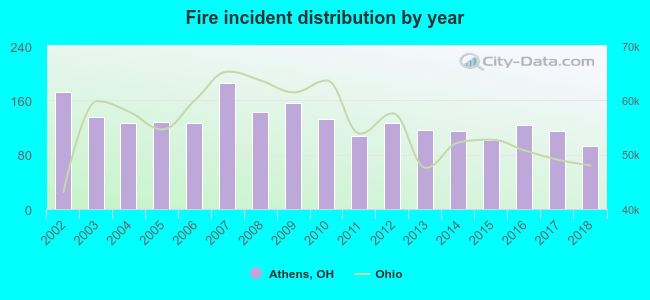 According to the data from the years 2002 - 2018 the average number of fire incidents per year is 129. The highest number of fires - 185 took place in 2007, and the least - 93 in 2018. The data has a declining trend.
 The median response time based on all reported fire incidents is 5 minutes. This is lower than the Ohio median value.
The median response time in Athens, OH compared to nearest cities:
(Note: Based on data for all years, including only cities with at least 500 fire incidents)
| Athens: | 5 minutes |
| Nelsonville: | 7 minutes |
| Glouster: | 7 minutes |
| Pomeroy: | 8 minutes |
| McArthur: | 11 minutes |
| Logan: | 10 minutes |
| New Lexington: | 11 minutes |
| Belpre: | 7 minutes |
| Wellston: | 7 minutes |
 Based on the reports from the years 2002 - 2018 the average number of fire-related fatalities per year is 0. The highest number of deaths - 1 took place in 2002, and the lowest - 0 in 2003. The data has a declining trend.
 Based on the data from the years 2002 - 2018 the average number of fire-related casualties per year is 1. The highest number of casualties - 7 took place in 2014, and the lowest - 0 in 2004. The data has a constant trend.
The average number of casualties per 1,000 fire incidents is 12. This indicator was the highest - 61 in 2014, and the lowest 0 in 2004. The trend for casualties per 1,000 incidents is growing. Compared to the Ohio value the number of injuries per 1,000 incidents is lower.
Based on the data from the years 2002 - 2018 the average number of fire-related casualties per year is 1. The highest number of casualties - 7 took place in 2014, and the lowest - 0 in 2004. The data has a constant trend.
The average number of casualties per 1,000 fire incidents is 12. This indicator was the highest - 61 in 2014, and the lowest 0 in 2004. The trend for casualties per 1,000 incidents is growing. Compared to the Ohio value the number of injuries per 1,000 incidents is lower.Casualties per 1,000 incidents in Athens, OH compared to nearest cities:
(Note: Based on data for all years, including only cities with at least 500 fire incidents)
| Athens: | 11.4 |
| Nelsonville: | 4.2 |
| Glouster: | 3.7 |
| Pomeroy: | 2.7 |
| McArthur: | 5.0 |
| Logan: | 10.4 |
| New Lexington: | 2.7 |
| Belpre: | 7.0 |
| Wellston: | 21.4 |
 36.0% incidents where reported in the morning and 64.0% in the evening. The most fires (17.5%) took place on Sunday, and the least (11.3%) on Tuesday.
 According to the 2,201 fire incident reports from years 2002 - 2018 most fires (11.7%) took place during April, and the least (4.5%) in December.
 Out of all 10,587 cases reported during the years 2002 - 2018, the most belonged to the categories: Hazardous Condition (31.7%), False Alarm (28.1%), and Fire (20.8%).
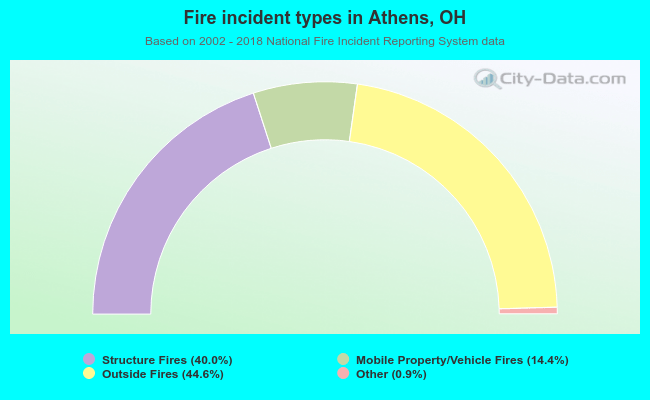 When looking into fire subcategories, the most incidents belonged to: Outside Fires (44.6%), and Structure Fires (40.0%).