Ashdown: Fire Incidents, Arkansas (AR)
Where are fire incidents reported in Ashdown, AR
Something went wrong! Please refresh the page.
|
| |||||||||||||||||||||||||||||||||||||||||||||||||||||||||||||||||||||||||||||||||||||||||||||||||||||||||||||
| Other | 431 | |||||||||||||||||||||||||||||||||||||||||||||||||||||||||||||||||||||||||||||||||||||||||||||||||||||||||||||
2002 - 2018 National Fire Incident Reporting System (NFIRS) incidents
- Incident types reported to NFIRS in Ashdown, AR
- 85556.4%Fire
- 43528.7%Rescue & EMS
- 724.7%Good Intent Call
- 644.2%Hazardous Condition
- 503.3%False Alarm
- 271.8%Service Call
- 60.4%Overpressure Rupture
- 50.3%Severe Weather
- 20.1%Special Incident
- Fire incident types reported to NFIRS in Ashdown, AR
- 46654.5%Outside Fires
- 25830.2%Structure Fires
- 9511.1%Mobile Property/Vehicle Fires
- 364.2%Other
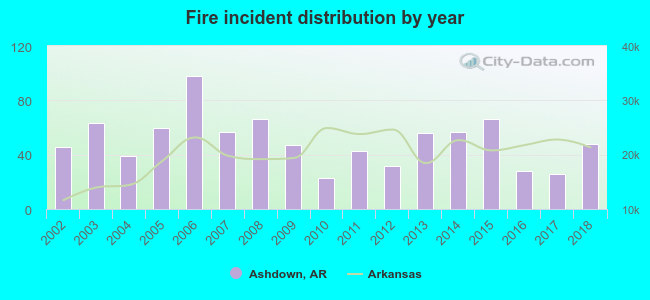 Based on the data from the years 2002 - 2018 the average number of fires per year is 50. The highest number of fires - 98 took place in 2006, and the least - 23 in 2010. The data has an increasing trend.
 The median response time based on all reported fire incidents is 7 minutes. This is similar to the Arkansas median value.
 According to the data from the years 2002 - 2018 the average number of fire-related yearly deaths is 0. The highest number of reported deaths - 1 took place in 2006, and the lowest - 0 in 2002. The data has a constant trend.
 30.2% incidents where reported in the morning and 69.8% in the evening. The most fires (16.3%) took place on Saturday, and the least (13.1%) on Monday.
 According to the 855 fires from years 2002 - 2018 most fires (12.6%) took place during January, and the least (5.1%) in November.
 Out of all 1,516 cases reported during the years 2002 - 2018, the most belonged to the categories: Fire (56.4%), Rescue & EMS (28.7%), and Good Intent Call (4.7%).
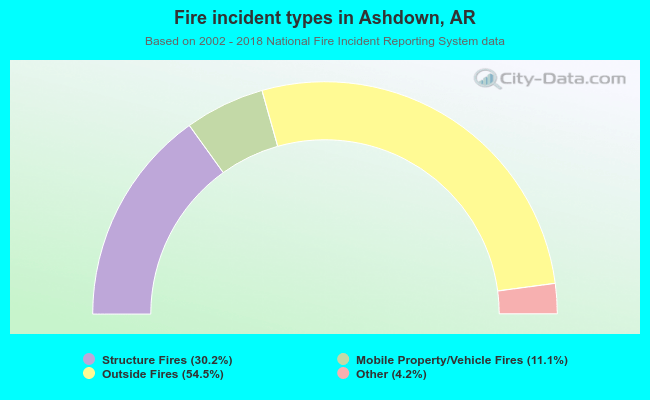 When looking into fire subcategories, the most incidents belonged to: Outside Fires (54.5%), and Structure Fires (30.2%).