Apollo: Fire Incidents, Pennsylvania (PA)
Where are fire incidents reported in Apollo, PA
Something went wrong! Please refresh the page.
|
| |||||||||||||||||||||||||||||||||||||||||||||||||||||||||||||||||||||||||||||||||||||||||||||||||||||||||||||
| Other | 161 | |||||||||||||||||||||||||||||||||||||||||||||||||||||||||||||||||||||||||||||||||||||||||||||||||||||||||||||
2003 - 2018 National Fire Incident Reporting System (NFIRS) incidents
- Incident types reported to NFIRS in Apollo, PA
- 67733.2%Hazardous Condition
- 53326.1%Fire
- 36517.9%Rescue & EMS
- 23111.3%Good Intent Call
- 1236.0%Service Call
- 894.4%False Alarm
- 140.7%Severe Weather
- 60.3%Special Incident
- Fire incident types reported to NFIRS in Apollo, PA
- 28753.8%Structure Fires
- 15128.3%Outside Fires
- 5710.7%Other
- 387.1%Mobile Property/Vehicle Fires
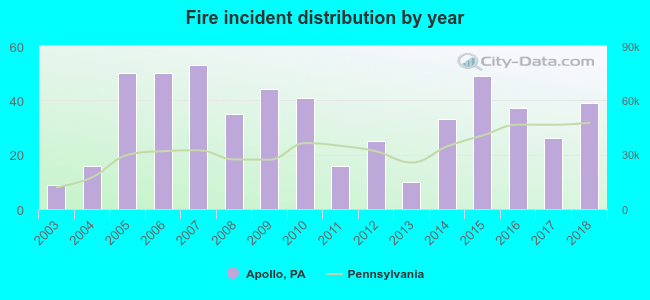 According to the data from the years 2003 - 2018 the average number of fires per year is 33. The highest number of reported fire incidents - 53 took place in 2007, and the least - 9 in 2003. The data has an increasing trend.
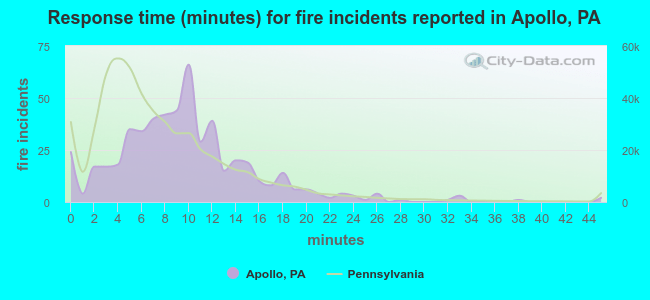 The median response time based on all reported fire incidents is 9 minutes. This is higher compared to the state median value.
The median response time in Apollo, PA compared to nearest cities:
(Note: Based on data for all years, including only cities with at least 500 fire incidents)
| Apollo: | 9 minutes |
| Vandergrift: | 5 minutes |
| Leechburg: | 9 minutes |
| New Kensington: | 6 minutes |
| Export: | 2 minutes |
| Murrysville: | 6 minutes |
| New Alexandria: | 2 minutes |
| Penn Hills: | 7 minutes |
| Monroeville: | 6 minutes |
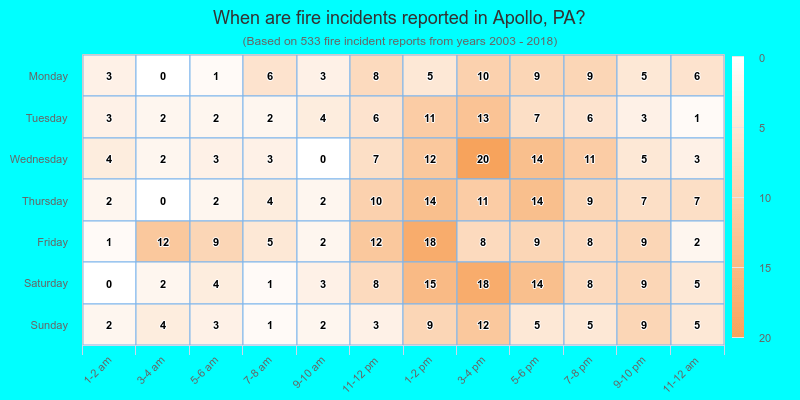
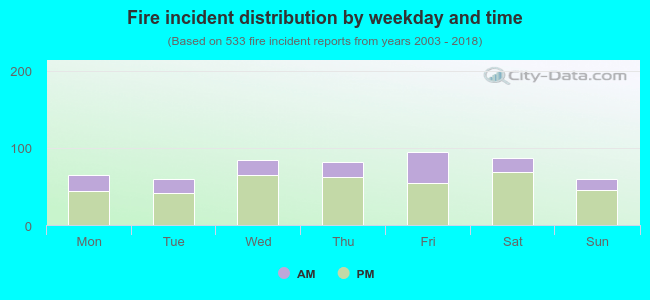 28.7% incidents where reported in the morning and 71.3% in the evening. The most fires (17.8%) took place on Friday, and the least (11.3%) on Tuesday.
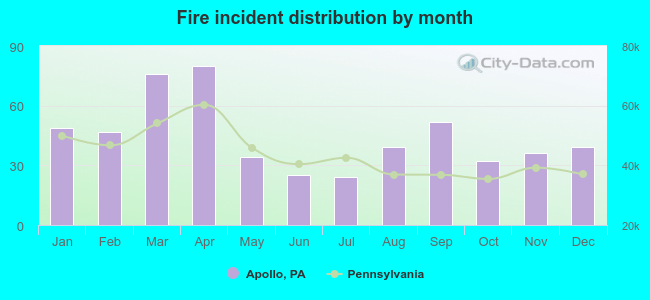 According to the 533 fire incident reports from years 2003 - 2018 most fires (15.0%) took place during April, and the least (4.5%) in July.
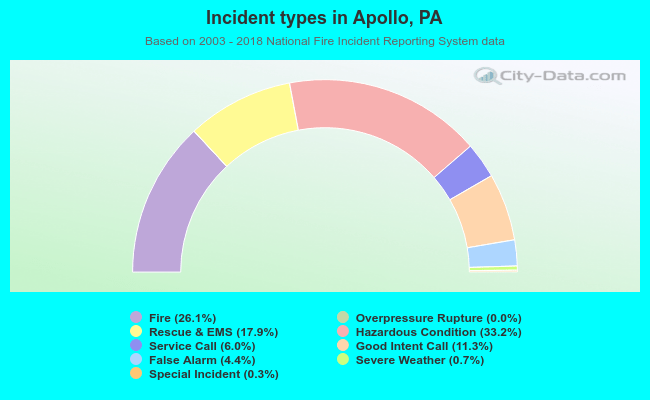 Out of all 2,039 cases reported during the years 2003 - 2018, the most belonged to the categories: Hazardous Condition (33.2%), Fire (26.1%), and Rescue & EMS (17.9%).
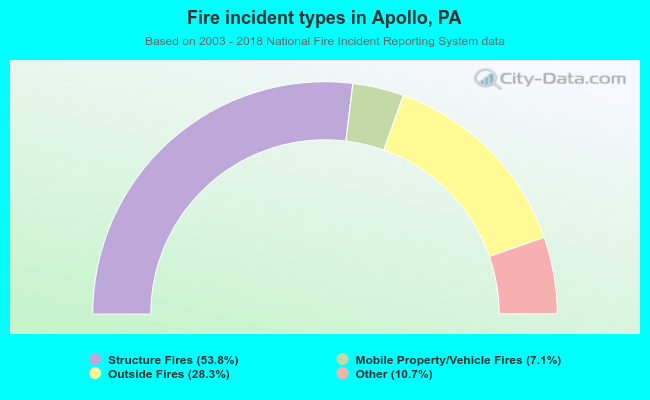 When looking into fire subcategories, the most incidents belonged to: Structure Fires (53.8%), and Outside Fires (28.3%).