Ada: Fire Incidents, Ohio (OH)
Where are fire incidents reported in Ada, OH
Something went wrong! Please refresh the page.
|
| |||||||||||||||||||||||||||||||||||||||||||||||||||||||||||||||||||||||||||||||||||||||||||||||||||||||||||||
2003 - 2018 National Fire Incident Reporting System (NFIRS) incidents
- Incident types reported to NFIRS in Ada, OH
- 44350.5%Fire
- 17620.1%Rescue & EMS
- 819.2%False Alarm
- 738.3%Good Intent Call
- 596.7%Hazardous Condition
- 404.6%Service Call
- 30.3%Severe Weather
- 20.2%Overpressure Rupture
- Fire incident types reported to NFIRS in Ada, OH
- 25758.0%Structure Fires
- 14532.7%Outside Fires
- 419.3%Mobile Property/Vehicle Fires
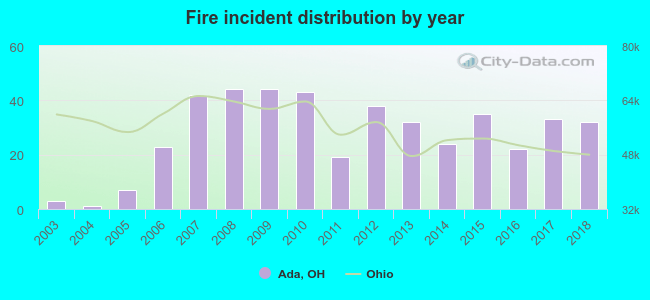 Based on the data from the years 2003 - 2018 the average number of fire incidents per year is 28. The highest number of fires - 44 took place in 2008, and the least - 1 in 2004. The data has an increasing trend.
The average number of yearly fire incidents per 10k residents in Ada, OH compared to nearest cities:
(Note: Based on data for the last 3 years, including only cities with population 5,000 and above)
| Ada: | 49.7 |
| Kenton: | 112.4 |
| Lima: | 90.6 |
| Findlay: | 28.9 |
| Wapakoneta: | 66.9 |
| Delphos: | 75.3 |
| Bellefontaine: | 44.8 |
| Upper Sandusky: | 82.3 |

 31.8% incidents where reported in the morning and 68.2% in the evening. The most fires (21.0%) took place on Tuesday, and the least (10.2%) on Thursday.
 According to the 443 fires from years 2003 - 2018 most fires (15.1%) took place during March, and the least (4.3%) in August.
 Out of all 877 cases reported during the years 2003 - 2018, the most belonged to the categories: Fire (50.5%), Rescue & EMS (20.1%), and False Alarm (9.2%).
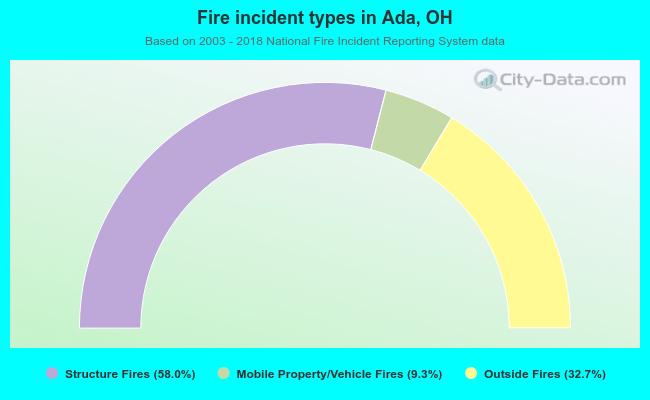 When looking into fire subcategories, the most incidents belonged to: Structure Fires (58.0%), and Outside Fires (32.7%).