Crime rate in Macon, Georgia (GA): murders, rapes, robberies, assaults, burglaries, thefts, auto thefts, arson, law enforcement employees, police officers, crime map
Crime rate in Macon, GA
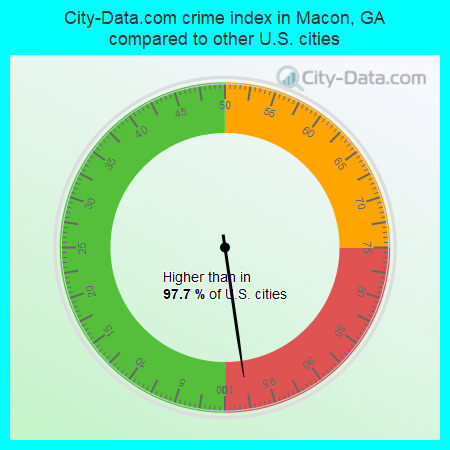
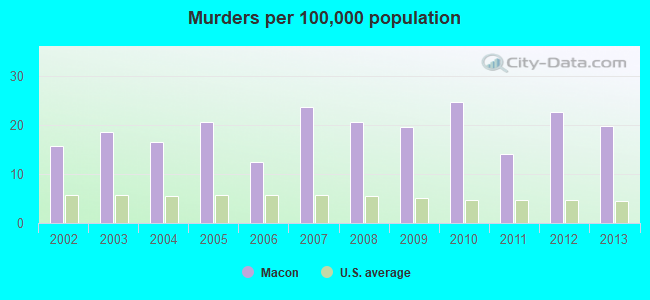
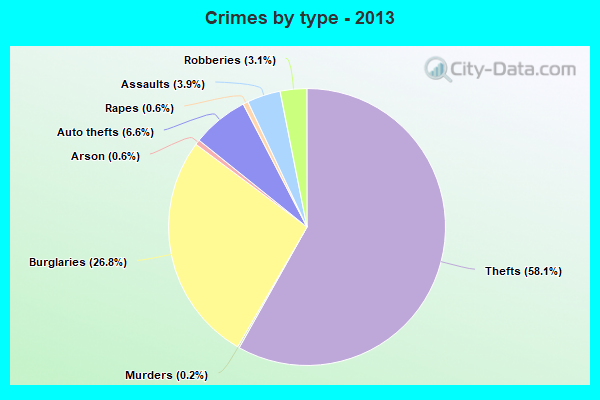
The 2013 crime rate in Macon, GA is 604 (City-Data.com crime index), which is 2.2 times higher than the U.S. average. It was higher than in 97.7% U.S. cities. The 2013 Macon crime rate rose by 3% compared to 2012. The number of homicides stood at 18 - a decrease of 3 compared to 2012. In the last 5 years Macon has seen decline of violent crime and increasing property crime.See how dangerous Macon, GA is compared to the nearest cities:
(Note: Higher means more crime)
(Note: Higher means more crime)
| Macon: | 604.4 |
| Gray: | 109.8 |
| Centerville: | 169.0 |
| Byron: | 149.7 |
| Warner Robins: | 390.1 |
| Gordon: | 141.3 |
| Jeffersonville: | 31.3 |
| Ivey: | 58.1 |
| Forsyth: | 318.2 |
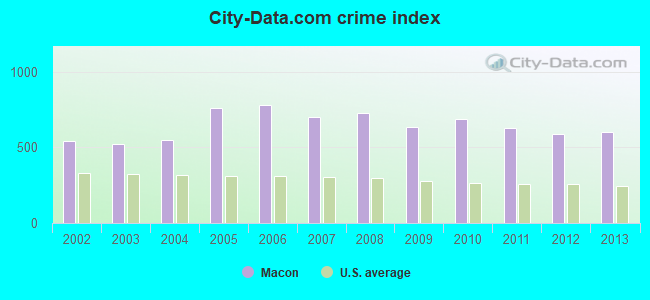
The City-Data.com crime index weighs serious crimes and violent crimes more heavily. Higher means more crime, U.S. average is 270.6. It adjusts for the number of visitors and daily workers commuting into cities.
- means the value is about the same as the state average.- means the value is bigger than the state average.
- means the value is much bigger than the state average.
According to our research of Georgia and other state lists, there were 636 registered sex offenders living in Macon, Georgia as of July 04, 2024.
The ratio of all residents to sex offenders in Macon is 150 to 1.
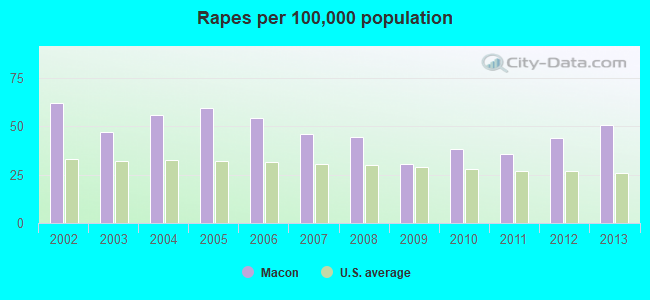
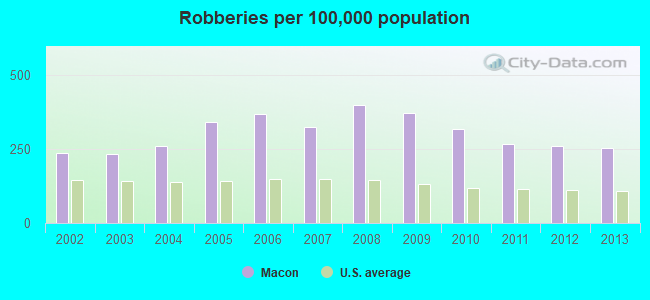
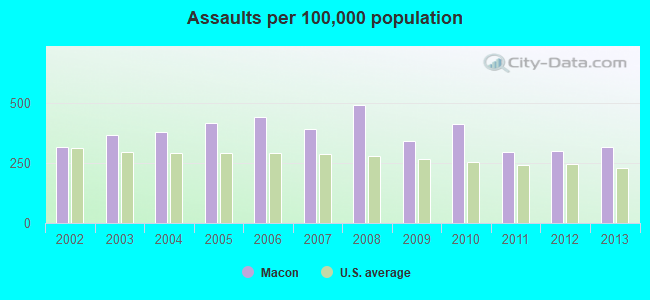
Violent crime rate in 2013
| Macon: | 374.5 |
| U.S. Average: | 204.3 |
Violent crime rate in 2012
| Macon: | 370.0 |
| U.S. Average: | 214.5 |
Violent crime rate in 2011
| Macon: | 344.7 |
| U.S. Average: | 214.1 |
Violent crime rate in 2010
| Macon: | 453.3 |
| U.S. Average: | 223.2 |
Violent crime rate in 2009
| Macon: | 425.8 |
| U.S. Average: | 238.0 |
Violent crime rate in 2008
| Macon: | 530.4 |
| U.S. Average: | 252.4 |
Violent crime rate in 2007
| Macon: | 451.2 |
| U.S. Average: | 259.7 |
Violent crime rate in 2006
| Macon: | 483.8 |
| U.S. Average: | 264.1 |
Violent crime rate in 2005
| Macon: | 478.5 |
| U.S. Average: | 258.9 |
Violent crime rate in 2004
| Macon: | 309.0 |
| U.S. Average: | 256.0 |
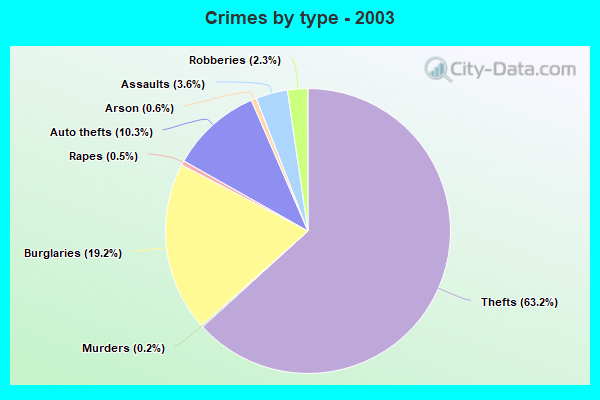
Violent crime rate in 2003
| Macon: | 290.2 |
| U.S. Average: | 262.6 |
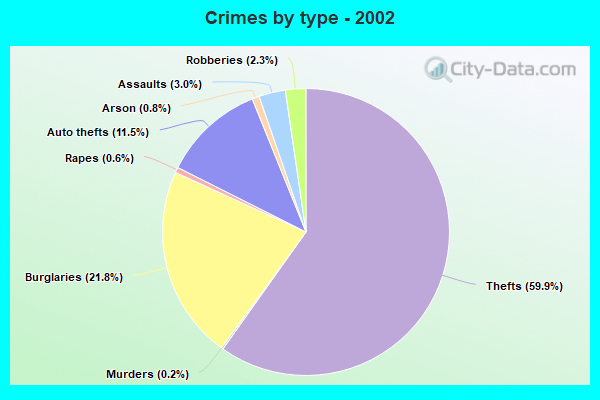
Violent crime rate in 2002
| Macon: | 278.3 |
| U.S. Average: | 272.2 |
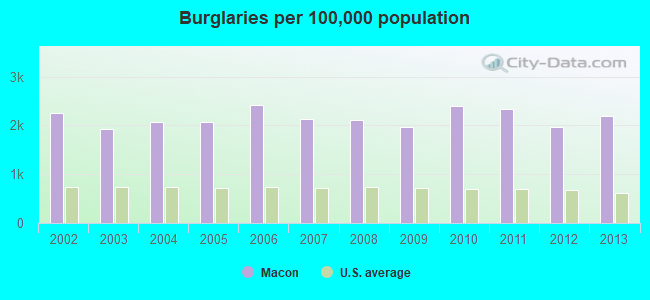
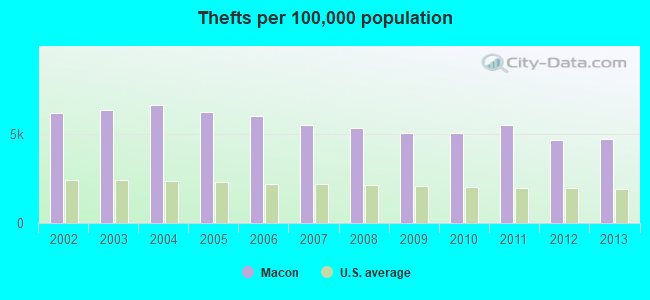
Property crime rate in 2013
| Macon: | 754.4 |
| U.S. Average: | 250.4 |
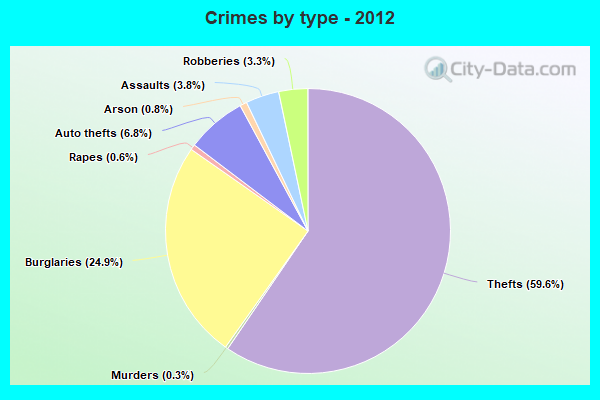
Property crime rate in 2012
| Macon: | 710.0 |
| U.S. Average: | 267.3 |
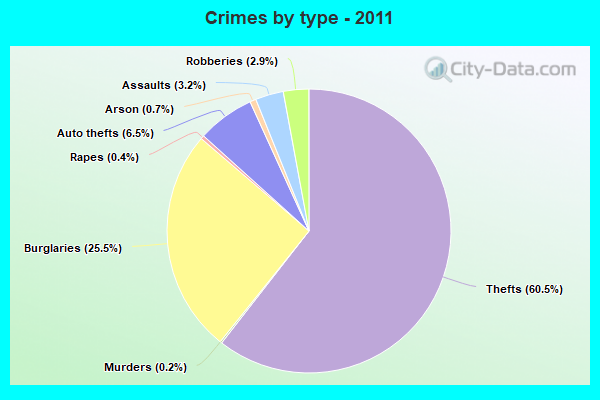
Property crime rate in 2011
| Macon: | 830.2 |
| U.S. Average: | 273.5 |
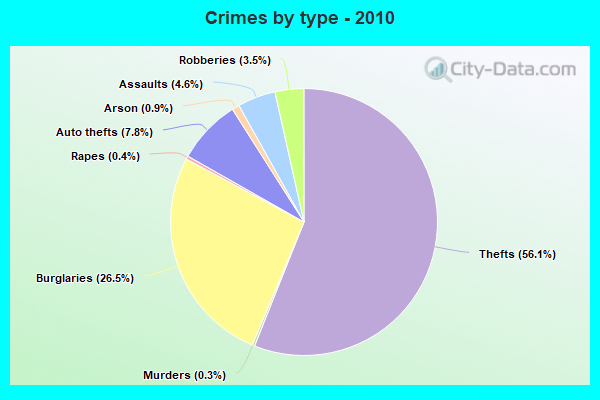
Property crime rate in 2010
| Macon: | 837.9 |
| U.S. Average: | 276.4 |
Property crime rate in 2009
| Macon: | 748.1 |
| U.S. Average: | 285.6 |
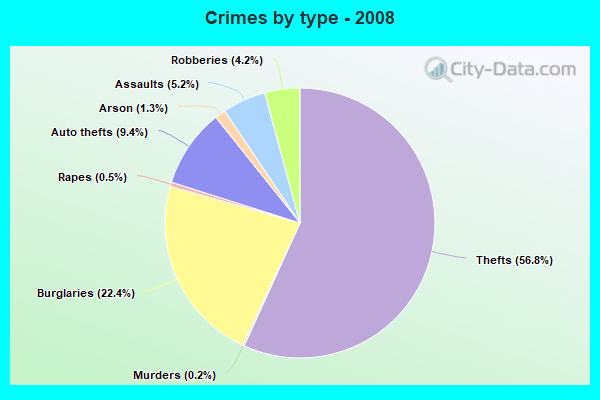
Property crime rate in 2008
| Macon: | 826.0 |
| U.S. Average: | 302.2 |
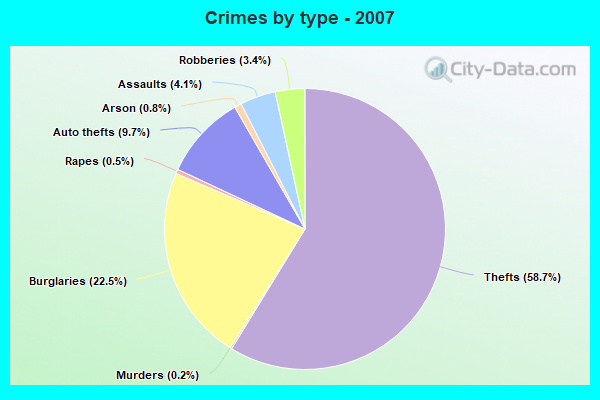
Property crime rate in 2007
| Macon: | 838.9 |
| U.S. Average: | 309.2 |
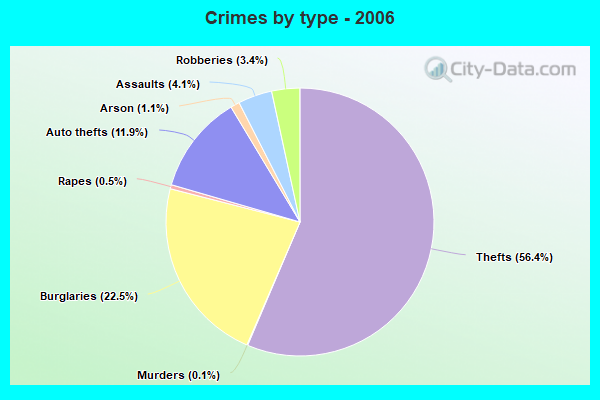
Property crime rate in 2006
| Macon: | 977.5 |
| U.S. Average: | 317.3 |
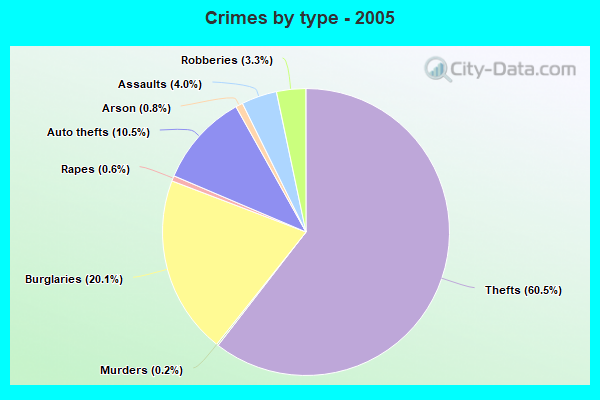
Property crime rate in 2005
| Macon: | 892.9 |
| U.S. Average: | 322.3 |
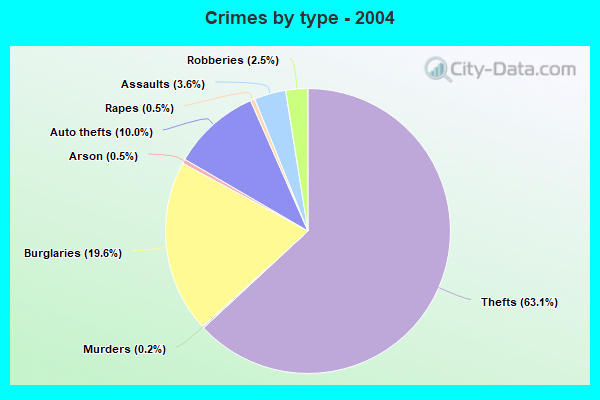
Property crime rate in 2004
| Macon: | 684.5 |
| U.S. Average: | 327.4 |
Property crime rate in 2003
| Macon: | 650.2 |
| U.S. Average: | 334.1 |
Property crime rate in 2002
| Macon: | 709.0 |
| U.S. Average: | 336.9 |
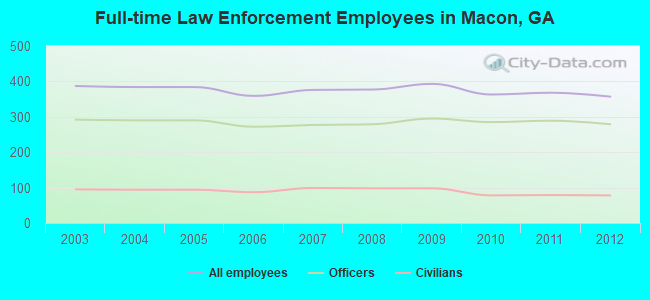
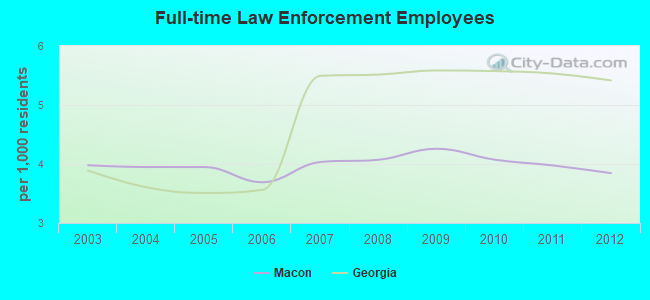
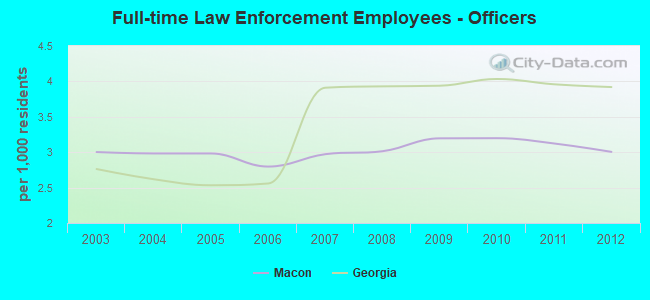
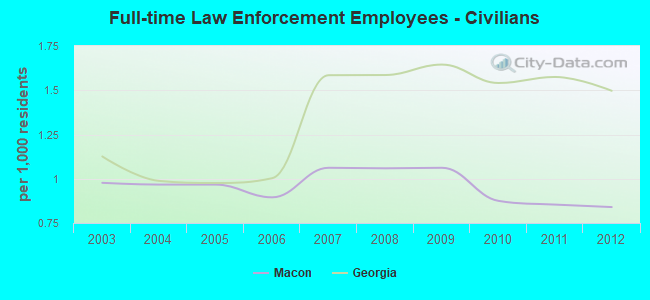
Full-time law enforcement employees in 2012, including police officers: 357 (279 officers).
| Officers per 1,000 residents here: | 3.01 |
| Georgia average: | 3.92 |
Full-time law enforcement employees in 2011, including police officers: 368 (289 officers).
| Officers per 1,000 residents here: | 3.12 |
| Georgia average: | 3.96 |
Full-time law enforcement employees in 2010, including police officers: 363 (285 officers).
| Officers per 1,000 residents here: | 3.20 |
| Georgia average: | 4.03 |
Full-time law enforcement employees in 2009, including police officers: 393 (295 officers).
| Officers per 1,000 residents here: | 3.20 |
| Georgia average: | 3.94 |
Full-time law enforcement employees in 2008, including police officers: 377 (279 officers).
| Officers per 1,000 residents here: | 3.01 |
| Georgia average: | 3.93 |
Full-time law enforcement employees in 2007, including police officers: 376 (277 officers).
| Officers per 1,000 residents here: | 2.97 |
| Georgia average: | 3.91 |
Full-time law enforcement employees in 2006, including police officers: 359 (272 officers).
| Officers per 1,000 residents here: | 2.80 |
| Georgia average: | 2.56 |
Full-time law enforcement employees in 2004, including police officers: 384 (290 officers).
| Officers per 1,000 residents here: | 2.98 |
| Georgia average: | 2.62 |
Full-time law enforcement employees in 2003, including police officers: 387 (292 officers).
| Officers per 1,000 residents here: | 3.00 |
| Georgia average: | 2.76 |

Zip codes: 31201, 31204, 31206, 31207, 31210, 31211, 31213, 31217.