Rio Arriba County, New Mexico (NM)
County owner-occupied free and clear houses and condos in 2010: 7,307
County owner-occupied houses and condos in 2000: 12,296
Renter-occupied apartments: 3,240 (it was 2,748 in 2000)
| % of renters here: | 18% |
| State: | 31% |
Land area: 5858 sq. mi.
Water area: 38.5 sq. mi.
Population density: 7 people per square mile (very low).
Industries providing employment: Educational, health and social services (25.0%), Professional, scientific, management, administrative, and waste management services (20.3%), Arts, entertainment, recreation, accommodation and food services (10.1%).
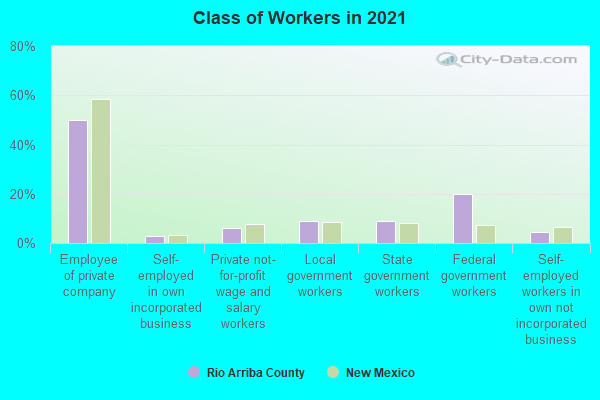
Type of workers:
- Private wage or salary: 55%
- Government: 39%
- Self-employed, not incorporated: 6%
- Unpaid family work: 0%
- OSM Map
- General Map
- Google Map
- MSN Map

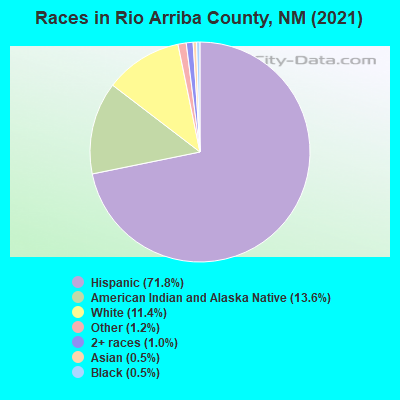
- 28,93571.8%Hispanic or Latino
- 5,40713.4%American Indian and Alaska Native alone
- 4,74311.8%White Non-Hispanic Alone
- 4531.1%Two or more races
- 2860.7%Some other race alone
- 2410.6%Asian alone
- 2220.6%Black Non-Hispanic Alone
- 60.01%Native Hawaiian and Other
Pacific Islander alone
| Median resident age: | 42.6 years |
| New Mexico median age: | 39.4 years |
| Males: 19,757 | |
| Females: 20,544 |

 | New Mexico Covid-19 discussion (429 replies) |
| Man wants Espanola to be part of Rio Arriba County (2 replies) |
| Looking for NM Advice (25 replies) |
| Considering relocating to New Mexico (28 replies) |
| How Will New Mexicans Vote in the General Election? (36 replies) |
| Considering Move To Eldorado Concerned With Dust And The Water (14 replies) |
| Rio Arriba County: | 2.0 people |
| New Mexico: | 3 people |
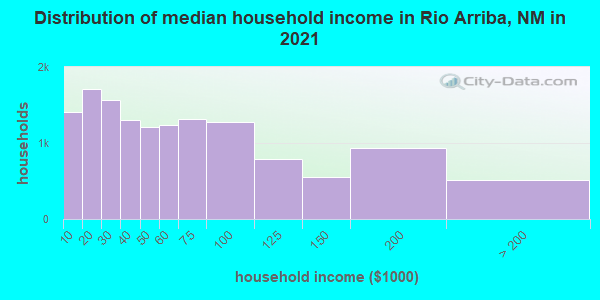
Estimated median household income in 2022: $52,920 ($29,429 in 1999)
| This county: | $52,920 |
| New Mexico: | $59,726 |
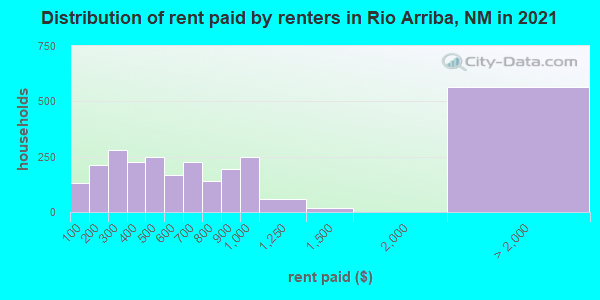
Median contract rent in 2022 for apartments: $488 (lower quartile is $320, upper quartile is $762)
| This county: | $488 |
| State: | $816 |
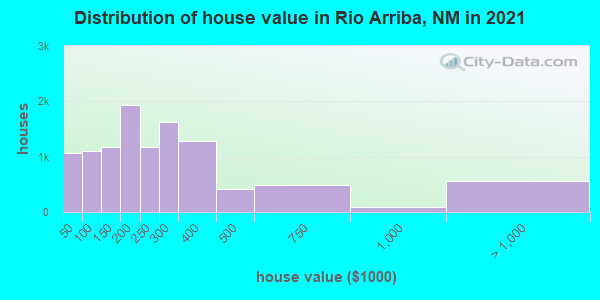
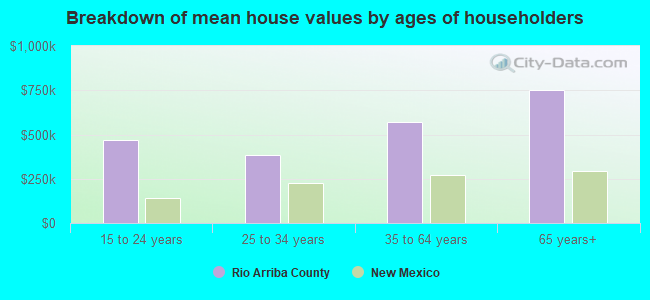
Estimated median house or condo value in 2022: $239,386 (it was $88,600 in 2000)
| Rio Arriba: | $239,386 |
| New Mexico: | $243,100 |
Median monthly housing costs for homes and condos with a mortgage: $1,361
Median monthly housing costs for units without a mortgage: $342
Institutionalized population: 238
Crime in 2020 (reported by the sheriff's office or county police, not the county total):
- Murders: 0
- Rapes: 2
- Robberies: 2
- Assaults: 36
- Burglaries: 49
- Thefts: 46
- Auto thefts: 11
Crime in 2019 (reported by the sheriff's office or county police, not the county total):
- Murders: 0
- Rapes: 5
- Robberies: 2
- Assaults: 36
- Burglaries: 69
- Thefts: 59
- Auto thefts: 13
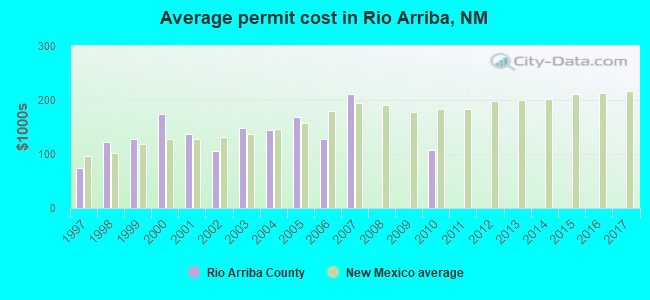
Single-family new house construction building permits:
- 2017: 0 buildings
- 2016: 0 buildings
- 2015: 0 buildings
- 2014: 0 buildings
- 2013: 0 buildings
- 2012: 0 buildings
- 2011: 0 buildings
- 2010: 3 buildings, average cost: $106,500
- 2009: 0 buildings
- 2008: 0 buildings
- 2007: 4 buildings, average cost: $210,800
- 2006: 13 buildings, average cost: $128,100
- 2005: 13 buildings, average cost: $167,700
- 2004: 14 buildings, average cost: $144,800
- 2003: 10 buildings, average cost: $148,000
- 2002: 6 buildings, average cost: $105,600
- 2001: 11 buildings, average cost: $137,100
- 2000: 9 buildings, average cost: $174,800
- 1999: 13 buildings, average cost: $126,800
- 1998: 15 buildings, average cost: $122,500
- 1997: 17 buildings, average cost: $73,600

Median real estate property taxes paid for housing units with mortgages in 2022: $1,190 (0.4%)
Median real estate property taxes paid for housing units with no mortgage in 2022: $804 (0.4%)
| Rio Arriba County: | 21.0% |
| New Mexico: | 17.6% |
Median age of residents in 2022: 42.6 years old
(Males: 41.4 years old, Females: 44.1 years old)
(Median age for: White residents: 62.6 years old, Black residents: 32.7 years old, American Indian residents: 36.6 years old, Asian residents: 46.2 years old, Hispanic or Latino residents: 40.7 years old, Other race residents: 39.7 years old)
Fair market rent in 2006 for a 1-bedroom apartment in Rio Arriba County is $414 a month.
Fair market rent for a 2-bedroom apartment is $489 a month.
Fair market rent for a 3-bedroom apartment is $633 a month.
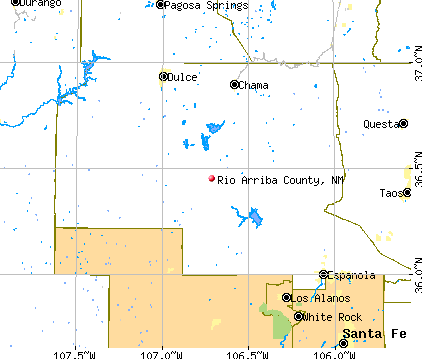
Cities in this county include: Espanola, South Rio Arriba, San Juan Pueblo, Rio Chama, Tierra Amarilla, Chimayo, Jicarilla, Dulce, La Mesilla, Coyote.
2023 air pollution in Rio Arriba County:
Ozone (1-hour): 0.042 ppm (standard limit: 0.12 ppm). Above U.S. average.
Notable locations in this county outside city limits:
Notable locations in Rio Arriba County: Lake Valley Chapter House (A), Mokie Indian Ruin (B), Pueblo Bonito Ranger Station (C), San Juan Basin Field (D), Sargent Ranch (E), Ship Rock Campground (F), Sulphur Spring Campground (G), Toh-Ni-Tsa Lookout (H), Tsah Tah Trading Post (I), Tsaya Trading Post (J), Two Cross Ranch (K), Wallace Ranch (L), Zia Trading Post (M), Carson Trading Post (N), Windmill Number A-11 (O), Windmill Number A-12 (P), Chettro Kettle (Q), Adobe Downs Ranch (R), Wilson Ranch (S), Deckers Camp (T). Display/hide their locations on the map
Shopping Center: Animas Valley Mall (1). Display/hide its location on the map
Churches in Rio Arriba County include: San Juan Mission (A), Navajo Miracle Church (B). Display/hide their locations on the map
Cemeteries: Hammond Cemetery (1), Dustin Masonic Memorial Park (2), Flora Vista Cemetery (3), Jewett Valley Cemetery (4). Display/hide their locations on the map
Lakes and reservoirs: Hugh Lake (A), Tocito Lake (B), Chimney Pond (C), Locke Lake (D), Todacheene Lake (E), Crow Lake (F), Jeters Lake (G), Long Lake (H). Display/hide their locations on the map
Streams, rivers, and creeks: Tuntsa Wash (A), Naschitti Wash (B), Crystal Creek (C), To-nil-choni Wash (D), Mancos River (E), Kimbeto Wash (F), Chaco River (G), De-na-zin Wash (H), Indian Creek (I). Display/hide their locations on the map
Parks in Rio Arriba County include: Ah-shi-sle-pah Wilderness Study Area (1), Old Indian Racetrack Historic Site (2), Four Corners (3), Hogback Historical Marker (4), Shiprock Historical Marker (5), Chaco Culture National Historic Park Historical Marker (6), Chaco Culture National Historical Park (7). Display/hide their locations on the map
Neighboring counties: Gibson County, Tennessee  , La Plata County, Colorado
  , Jefferson County, Missouri , Nowata County, Oklahoma , Roger Mills County, Oklahoma , Lincoln County, Kentucky , Livingston County, Kentucky , Woods County, Oklahoma .
| Here: | 3.3% |
| New Mexico: | 3.6% |
Current college students: 2,050
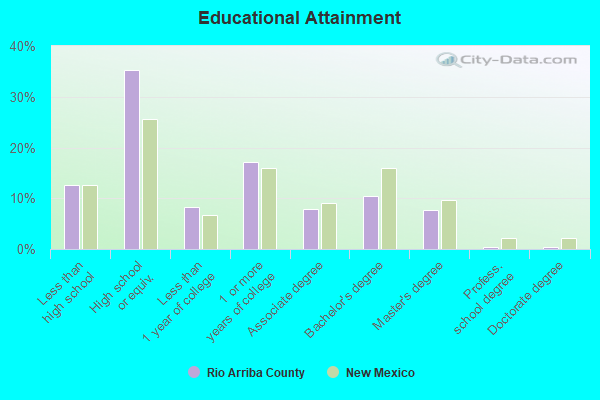
People 25 years of age or older with a high school degree or higher: 85.3%
People 25 years of age or older with a bachelor's degree or higher: 18.2%
Number of foreign born residents: 2,250 (33.5% naturalized citizens)
| Rio Arriba County: | 5.6% |
| Whole state: | 9.3% |
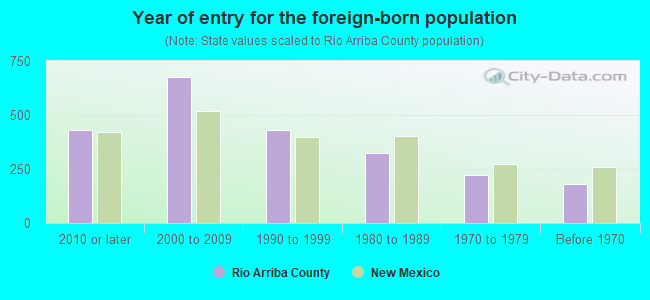
- Year of entry for the foreign-born population
- 6272010 or later
- 6942000 to 2009
- 4281990 to 1999
- 3261980 to 1989
- 2241970 to 1979
- 179Before 1970
Mean travel time to work (commute): minutes
Percentage of county residents living and working in this county: 99.6%
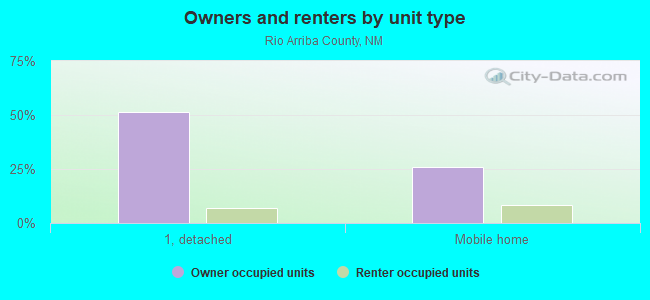
Housing units in structures:
- One, detached: 11,757
- One, attached: 159
- Two: 290
- 3 or 4: 158
- 5 to 9: 88
- 20 to 49: 43
- 50 or more: 37
- Mobile homes: 7,145
- Boats, RVs, vans, etc.: 16
Housing units in Rio Arriba County with a mortgage: 4,054 (63 second mortgage, 0 home equity loan, 43 both second mortgage and home equity loan)
Houses without a mortgage: 36
| Here: | 10.0% with mortgage |
| State: | 98.8% with mortgage |
Religion statistics for Rio Arriba County
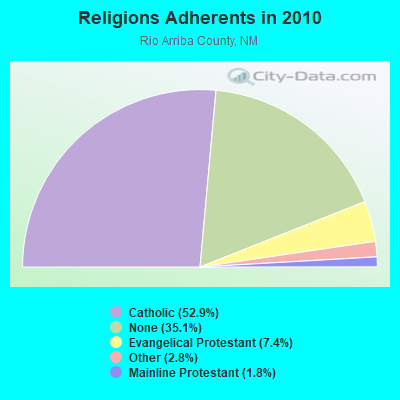
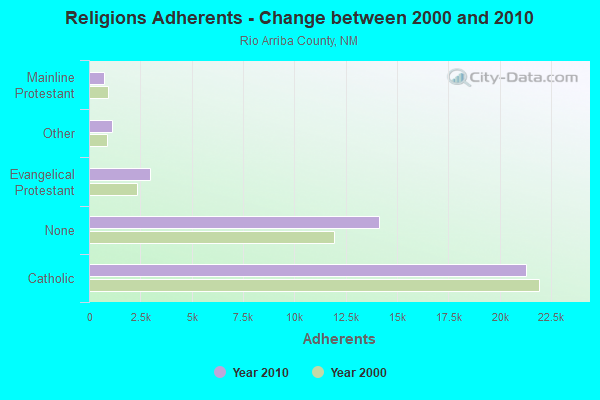
| Religion | Adherents | Congregations |
|---|---|---|
| Catholic | 21,305 | 41 |
| Evangelical Protestant | 2,960 | 29 |
| Other | 1,114 | 6 |
| Mainline Protestant | 722 | 9 |
| Orthodox | 5 | 1 |
| None | 14,140 | - |
Source: Clifford Grammich, Kirk Hadaway, Richard Houseal, Dale E.Jones, Alexei Krindatch, Richie Stanley and Richard H.Taylor. 2012. 2010 U.S.Religion Census: Religious Congregations & Membership Study. Association of Statisticians of American Religious Bodies. Jones, Dale E., et al. 2002. Congregations and Membership in the United States 2000. Nashville, TN: Glenmary Research Center.
Food Environment Statistics:
| Rio Arriba County: | 1.72 / 10,000 pop. |
| State: | 1.44 / 10,000 pop. |
| Here: | 0.25 / 10,000 pop. |
| New Mexico: | 0.21 / 10,000 pop. |
| This county: | 0.74 / 10,000 pop. |
| New Mexico: | 0.32 / 10,000 pop. |
| Rio Arriba County: | 5.16 / 10,000 pop. |
| New Mexico: | 4.06 / 10,000 pop. |
| This county: | 5.65 / 10,000 pop. |
| State: | 7.12 / 10,000 pop. |
| Rio Arriba County: | 5.9% |
| New Mexico: | 6.4% |
| Rio Arriba County: | 21.0% |
| State: | 22.1% |
Agriculture in Rio Arriba County:
Average size of farms: 1449 acresAverage value of agricultural products sold per farm: $10,679
The value of livestock, poultry, and their products as a percentage of the total market value of agricultural products sold: 83.41%
Average total farm production expenses per farm: $12,438
Average market value of all machinery and equipment per farm: $48,037
The percentage of farms operated by a family or individual: 92.71%
Average age of principal farm operators: 54 years
Average number of cattle and calves per 100 acres of all land in farms: 1.57
Milk cows as a percentage of all cattle and calves: 0.05%
Vegetables: 156 harvested acres
Land in orchards: 859 acres
Tornado activity:
Rio Arriba County historical area-adjusted tornado activity is significantly below New Mexico state average. It is 291966182.7 times below overall U.S. average.On 5/10/1957, a category 2 (max. wind speeds 113-157 mph) tornado killed one person and caused between $5000 and $50,000 in damages.
Earthquake activity:
Rio Arriba County-area historical earthquake activity is significantly above New Mexico state average. It is 904% greater than the overall U.S. average.On 8/23/2011 at 05:46:18, a magnitude 5.3 (5.3 MW, Depth: 2.5 mi, Class: Moderate, Intensity: VI - VII) earthquake occurred 119.6 miles away from Rio Arriba County center
On 6/28/1992 at 11:57:34, a magnitude 7.6 (6.2 MB, 7.6 MS, 7.3 MW, Depth: 0.7 mi, Class: Major, Intensity: VIII - XII) earthquake occurred 575.3 miles away from the county center, causing 3 deaths (1 shaking deaths, 2 other deaths) and 400 injuries, causing $100,000,000 total damage and $40,000,000 insured losses
On 8/10/2005 at 22:08:22, a magnitude 5.0 (5.0 MW, Depth: 3.1 mi) earthquake occurred 110.1 miles away from the county center
On 8/10/2005 at 22:08:22, a magnitude 5.0 (5.0 MB, 4.7 MS, 5.0 MW) earthquake occurred 113.0 miles away from the county center
On 8/18/1959 at 06:37:13, a magnitude 7.7 (7.7 UK) earthquake occurred 598.2 miles away from Rio Arriba County center, causing $26,000,000 total damage
On 10/16/1999 at 09:46:44, a magnitude 7.4 (6.3 MB, 7.4 MS, 7.2 MW, 7.3 ML) earthquake occurred 563.1 miles away from the county center
Magnitude types: body-wave magnitude (MB), local magnitude (ML), surface-wave magnitude (MS), moment magnitude (MW)
Most recent natural disasters:
- New Mexico Covid-19 Pandemic, Incident Period: January 20, 2020, FEMA Id: 4529, Natural disaster type: Other
- New Mexico Severe Storms and Flooding, Incident Period: July 27, 2014 to August 05, 2014, Major Disaster (Presidential) Declared DR-4197: October 06, 2014, FEMA Id: 4197, Natural disaster type: Storm, Flood
- New Mexico Severe Storms, Flooding, and Mudslides, Incident Period: September 09, 2013 to September 22, 2013, Major Disaster (Presidential) Declared DR-4152: October 29, 2013, FEMA Id: 4152, Natural disaster type: Storm, Mudslide, Flood
- New Mexico Las Conchas Fire, Incident Period: June 26, 2011 to August 25, 2011, Fire Management Assistance Declared: June 26, 2011, FEMA Id: 2933, Natural disaster type: Fire
- New Mexico Severe Winter Storm and Extreme Cold Temperatures, Incident Period: February 01, 2011 to February 05, 2011, Major Disaster (Presidential) Declared DR-1962: March 24, 2011, FEMA Id: 1962, Natural disaster type: Winter Storm
- New Mexico Hurricane Katrina Evacuation, Incident Period: August 29, 2005 to October 01, 2005, Emergency Declared EM-3229: September 07, 2005, FEMA Id: 3229, Natural disaster type: Hurricane
- New Mexico Borrego Fire, Incident Period: May 22, 2002 to June 10, 2002, Fire Management Assistance Declared: May 23, 2002, FEMA Id: 2408, Natural disaster type: Fire
- New Mexico New Mexico Wildfire, Incident Period: May 05, 2000 to June 09, 2000, Major Disaster (Presidential) Declared DR-1329: May 13, 2000, FEMA Id: 1329, Natural disaster type: Fire
- New Mexico New Mexico Fire, Incident Period: May 05, 2000 to July 07, 2000, Emergency Declared EM-3154: May 10, 2000, FEMA Id: 3154, Natural disaster type: Fire
- New Mexico Severe Storms and Flooding, Incident Period: July 16, 1999 to August 07, 1999, Major Disaster (Presidential) Declared DR-1301: September 22, 1999, FEMA Id: 1301, Natural disaster type: Storm, Flood
- 3 other natural disasters have been reported since 1953.
The number of natural disasters in Rio Arriba County (13) is near the US average (15).
Major Disasters (Presidential) Declared: 7
Emergencies Declared: 3
Causes of natural disasters: Floods: 5, Storms: 5, Fires: 4, Snows: 2, Drought: 1, Hurricane: 1, Mudslide: 1, Winter Storm: 1, Other: 1 (Note: some incidents may be assigned to more than one category).
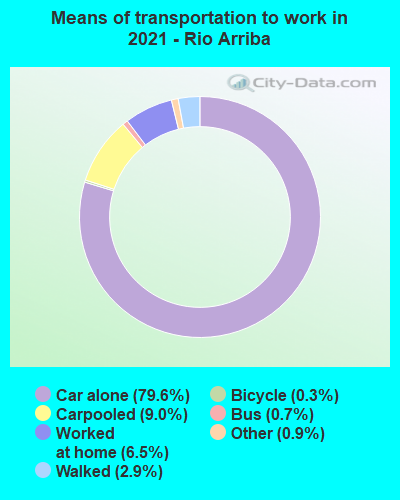
Means of transportation to work:
- Drove a car alone: 9,104 (73.7%)
- Carpooled: 1,001 (8.1%)
- Bus: 38 (0.3%)
- Taxicab, motorcycle, or other means: 167 (1.4%)
- Bicycle: 42 (0.3%)
- Walked: 446 (3.6%)
- Worked at home: 1,573 (12.7%)
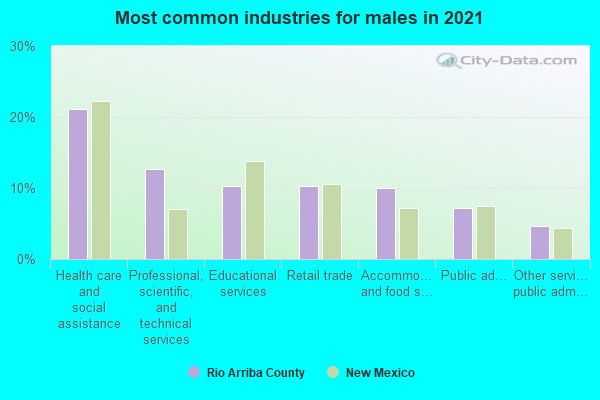
- Health care and social assistance (21%)
- Professional, scientific, and technical services (14%)
- Educational services (12%)
- Retail trade (9%)
- Accommodation and food services (9%)
- Public administration (6%)
- Other services, except public administration (4%)
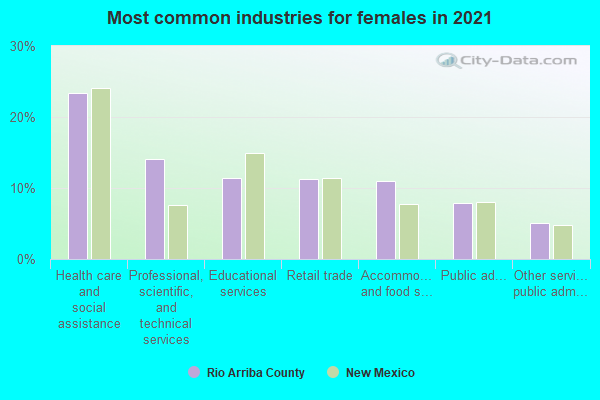
- Health care and social assistance (23%)
- Professional, scientific, and technical services (15%)
- Educational services (13%)
- Retail trade (10%)
- Accommodation and food services (9%)
- Public administration (7%)
- Other services, except public administration (5%)
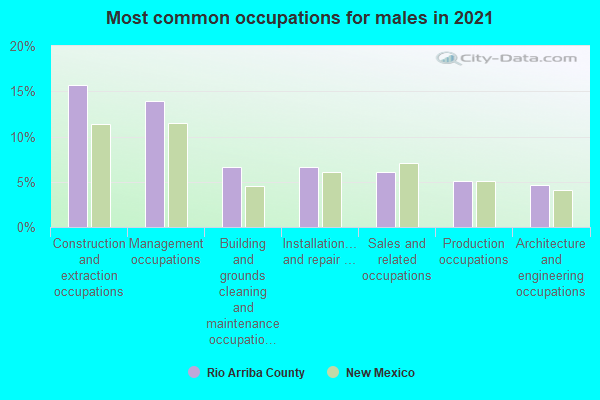
- Construction and extraction occupations (15%)
- Management occupations (11%)
- Installation, maintenance, and repair occupations (7%)
- Sales and related occupations (7%)
- Building and grounds cleaning and maintenance occupations (6%)
- Production occupations (5%)
- Architecture and engineering occupations (5%)
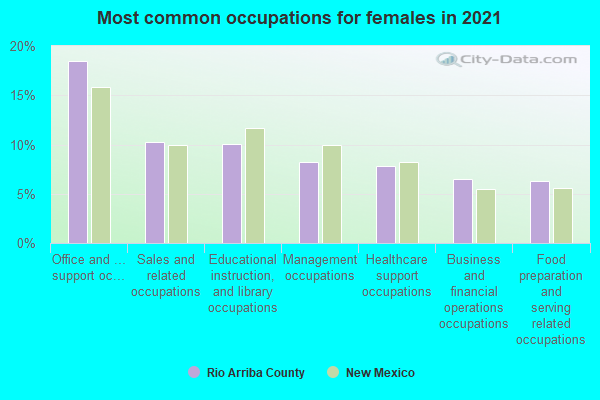
- Office and administrative support occupations (21%)
- Educational instruction, and library occupations (10%)
- Sales and related occupations (8%)
- Management occupations (8%)
- Healthcare support occupations (8%)
- Food preparation and serving related occupations (8%)
- Business and financial operations occupations (7%)
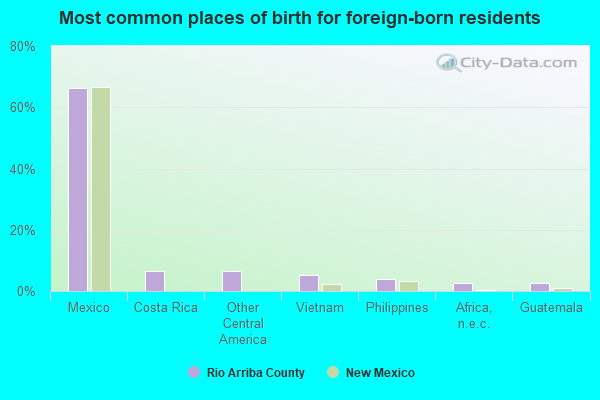
- Mexico (66%)
- Ecuador (8%)
- Vietnam (5%)
- Costa Rica (4%)
- Philippines (3%)
- Other Central America (3%)
- Guatemala (2%)
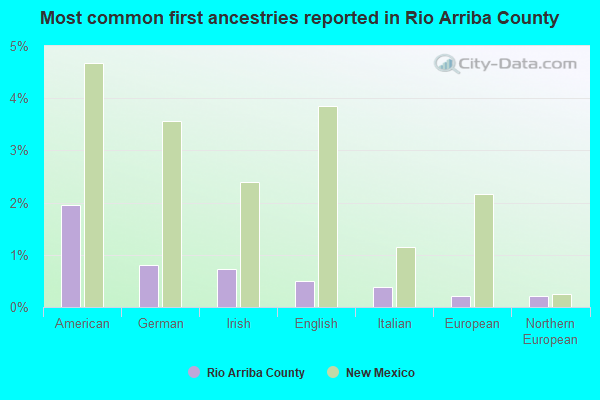
- American (3%)
- German (1%)
- Irish (1%)
- Italian (0%)
- English (0%)
- Scottish (0%)
- African (0%)
People in group quarters in Rio Arriba County, New Mexico in 2010:
- 155 people in local jails and other municipal confinement facilities
- 100 people in residential treatment centers for adults
- 83 people in nursing facilities/skilled-nursing facilities
- 63 people in other noninstitutional facilities
- 15 people in group homes intended for adults
- 9 people in workers' group living quarters and job corps centers
People in group quarters in Rio Arriba County, New Mexico in 2000:
- 148 people in homes or halfway houses for drug/alcohol abuse
- 127 people in local jails and other confinement facilities (including police lockups)
- 95 people in nursing homes
- 41 people in religious group quarters
- 23 people in other noninstitutional group quarters
- 17 people in homes for the mentally retarded
- 14 people in college dormitories (includes college quarters off campus)
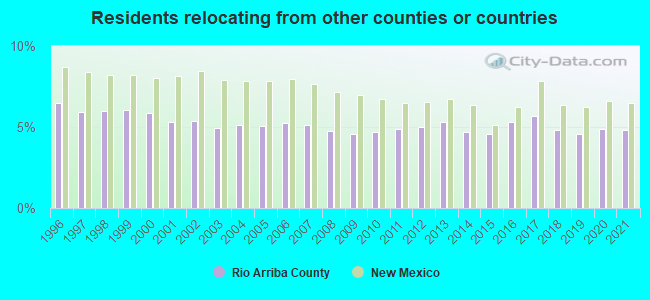
4.81% of this county's 2021 resident taxpayers lived in other counties in 2020 ($52,210 average adjusted gross income)
| Here: | 4.81% |
| New Mexico average: | 6.50% |
10 or fewer of this county's residents moved from foreign countries.
3.44% relocated from other counties in New Mexico ($35,651 average AGI)
1.37% relocated from other states ($16,557 average AGI)
Rio Arriba County: 1.37% New Mexico average: 3.84%
Top counties from which taxpayers relocated into this county between 2020 and 2021:
| from Santa Fe County, NM | |
| from Bernalillo County, NM | |
| from Taos County, NM | |
| from Los Alamos County, NM | |
| from Sandoval County, NM |
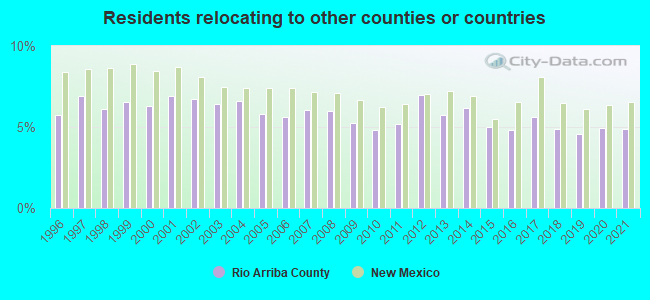
4.90% of this county's 2020 resident taxpayers moved to other counties in 2021 ($44,801 average adjusted gross income)
| Here: | 4.90% |
| New Mexico average: | 6.53% |
10 or fewer of this county's residents moved to foreign countries.
3.52% relocated to other counties in New Mexico ($30,898 average AGI)
1.38% relocated to other states ($13,904 average AGI)
Rio Arriba County: 1.38% New Mexico average: 3.90%
Top counties to which taxpayers relocated from this county between 2020 and 2021:
| to Santa Fe County, NM | |
| to Bernalillo County, NM | |
| to Sandoval County, NM | |
| to Taos County, NM | |
| to Los Alamos County, NM |
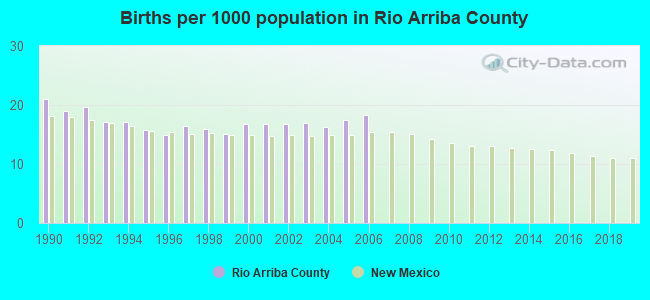
Births per 1000 population from 1990 to 1999: 17.2
Births per 1000 population from 2000 to 2006: 17.0
Deaths per 1000 population from 1990 to 1999: 7.4
Deaths per 1000 population from 2000 to 2009: 8.7
Deaths per 1000 population from 2010 to 2020: 10.4

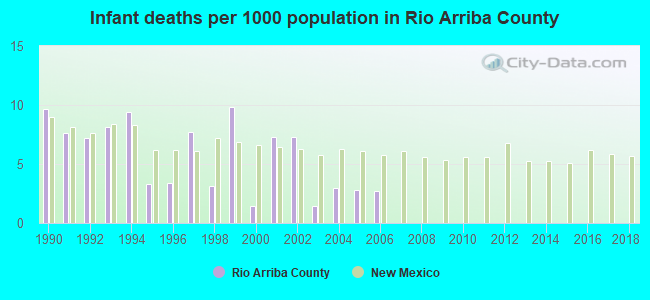
Infant deaths per 1000 live births from 1990 to 1999: 6.9
Infant deaths per 1000 live births from 2000 to 2006: 3.7
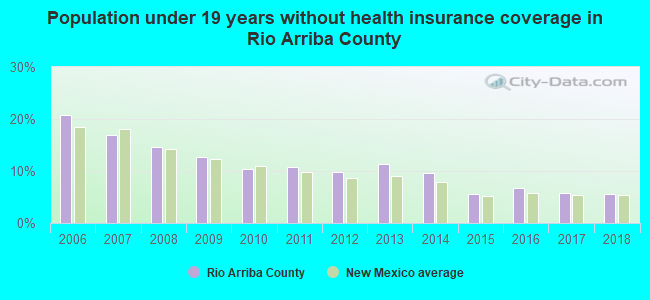
Persons under 19 years old without health insurance coverage in 2018: 5.5%

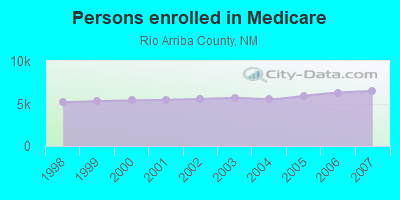
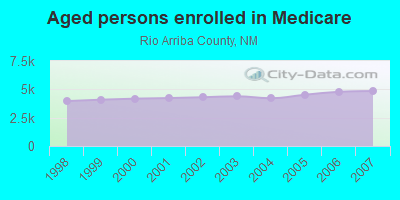
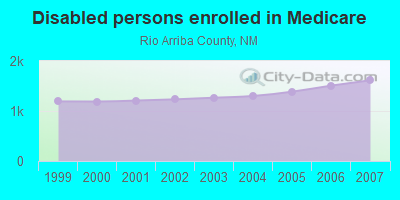
Persons enrolled in hospital insurance and/or supplemental medical insurance (Medicare) in July 1, 2007: 6,462 (4,847 aged, 1,615 disabled)
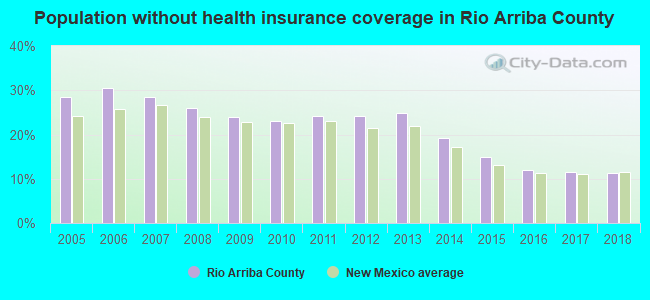
Children under 18 without health insurance coverage in 2007: 2,250 (21%)
Most common underlying causes of death in Rio Arriba County, New Mexico in 1999 - 2019:
- Atherosclerotic cardiovascular disease, so described (347)
- Accidental poisoning by and exposure to narcotics and psychodysleptics [hallucinogens], not elsewhere classified (239)
- Atherosclerotic heart disease (233)
- Acute myocardial infarction, unspecified (201)
- Chronic obstructive pulmonary disease, unspecified (187)
- Bronchus or lung, unspecified - Malignant neoplasms (167)
- Accidental poisoning by and exposure to other and unspecified drugs, medicaments and biological substances (139)
- Unspecified diabetes mellitus, without complications (118)
- Unspecified dementia (92)
- Other and unspecified cirrhosis of liver (81)
Population without health insurance coverage in 2000: 25%
Children under 18 without health insurance coverage in 2000: 21%
Short term general hospital admissions per 100,000 population in 2004: 6,065
Short term general hospital beds per 100,000 population in 2004: 197
Emergency room visits per 100,000 population in 2004: 30,032
General practice office based MDs per 100,000 population in 2005: 1,546
Medical specialist MDs per 100,000 population in 2005: 791
Dentists per 100,000 population in 1998: 7
Total births per 100,000 population, July 2005 - July 2006 : 21
Total deaths per 100,000 population, July 2005 - July 2006: 54
Limited-service eating places per 100,000 population in 2005 : 2
Homicides per 1,000,000 population from 2000 to 2006: 126.0. This is more than state average.
Suicides per 1,000,000 population from 2000 to 2006: 252.0. This is more than state average.
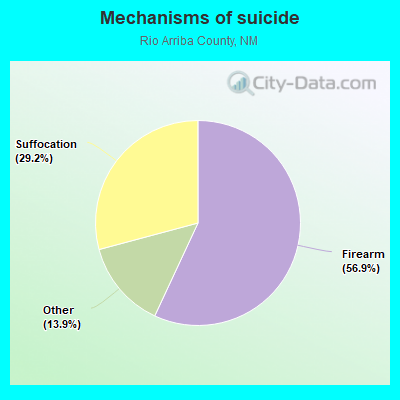
- Firearm - 143.5
- Suffocation - 73.5
- Other - 35.0
Household type by relationship:
Households: 40,301- Male householders: 7,332 (2,431 living alone), Female householders: 7,352 (2,526 living alone)
5,596 spouses (5,582 opposite-sex spouses), 1,260 unmarried partners, (1,216 opposite-sex unmarried partners), 12,626 children (11,881 natural, 274 adopted, 453 stepchildren), 1,927 grandchildren, 334 brothers or sisters, 880 parents, 105 foster children, 929 other relatives, 1,157 non-relatives
- In group quarters: 558
Size of family households: 4,604 2-persons, 2,238 3-persons, 1,351 4-persons, 533 5-persons, 149 6-persons, 56 7-or-more-persons.
Size of nonfamily households: 4,959 1-person, 774 2-persons, 18 3-persons, 39 7-or-more-persons.
3,365 married couples with children.
3,537 single-parent households (1,134 men, 2,403 women).
42.5% of residents of Rio Arriba speak English at home.
46.6% of residents speak Spanish at home (86% speak English very well, 10% speak English well, 3% speak English not well, 1% don't speak English at all).
0.2% of residents speak other Indo-European language at home (98% speak English very well, 2% speak English not well).
0.6% of residents speak Asian or Pacific Island language at home (83% speak English very well, 11% speak English well, 6% speak English not well).
6.9% of residents speak other language at home (80% speak English very well, 13% speak English well, 6% speak English not well).
In fiscal year 2004:
Federal Government expenditure: $316,435,000 ($7,773 per capita)
Department of Defense expenditure: $3,616,000
Federal direct payments to individuals for retirement and disability: $88,366,000
Federal other direct payments to individuals: $37,872,000
Federal direct payments not to individuals: $5,900,000
Federal grants: $160,891,000
Federal procurement contracts: $5,518,000 ($693,000 Department of Defense)
Federal salaries and wages: $17,887,000 ($526,000 Department of Defense)
Federal Government direct loans: $1,949,000
Federal guaranteed/insured loans: $4,020,000
Federal Government insurance: $39,625,000
Population change from April 1, 2000 to July 1, 2005:
Births: 3,638| Here: | 89 per 1000 residents |
| State: | 74 per 1000 residents |
Deaths: 1,505
| Here: | 37 per 1000 residents |
| State: | 36 per 1000 residents |
Net international migration: +484
| Here: | +12 per 1000 residents |
| State: | +15 per 1000 residents |
Net internal migration: -2,920
| Here: | |
| State: |
Total withdrawal of fresh water for public supply: 2.15 millions of gallons per day (70% from ground, 30% from surface)
| Here: | 5.5 |
| State: | 5.9 |
| Here: | 4.5 |
| State: | 4.2 |
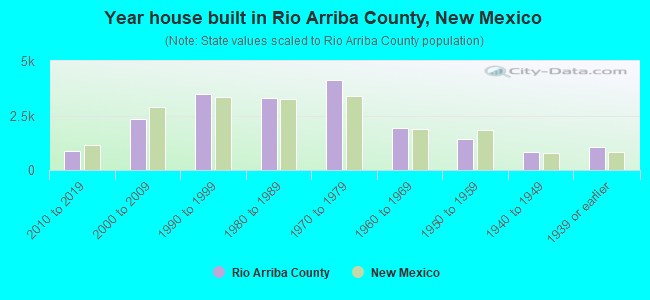
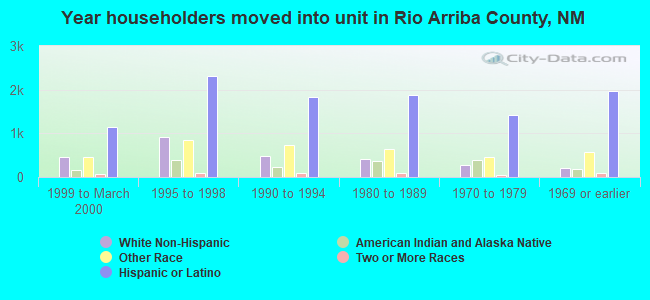
- Year house built in Rio Arriba County, New Mexico
- 872020 or later
- 8992010 to 2019
- 2,3492000 to 2009
- 3,5241990 to 1999
- 3,1911980 to 1989
- 4,2691970 to 1979
- 1,6921960 to 1969
- 1,3641950 to 1959
- 9101940 to 1949
- 1,0101939 or earlier
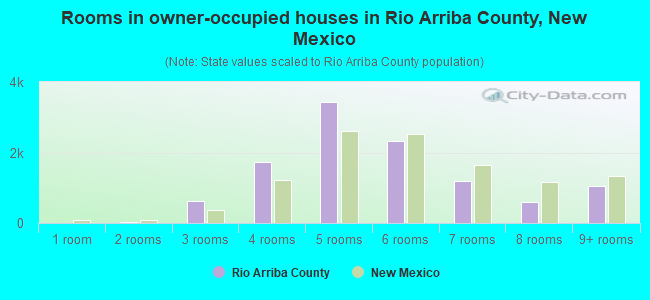
- Rooms in owner-occupied houses in Rio Arriba County, New Mexico
- 211 room
- 382 rooms
- 4973 rooms
- 2,1354 rooms
- 3,5755 rooms
- 2,5446 rooms
- 1,4007 rooms
- 7298 rooms
- 1,0429+ rooms
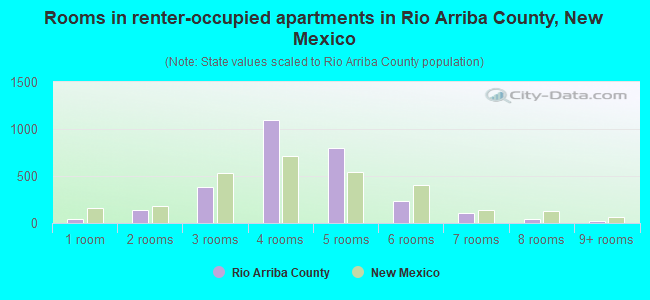
- Rooms in renter-occupied apartments in Rio Arriba County, New Mexico
- 431 room
- 1542 rooms
- 3513 rooms
- 8574 rooms
- 1,0195 rooms
- 2466 rooms
- 1297 rooms
- 378 rooms
- 219+ rooms
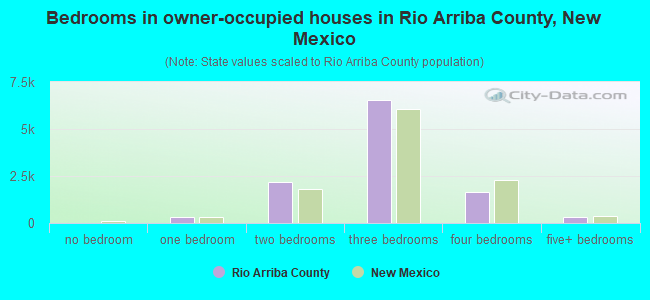
- Bedrooms in owner-occupied houses in Rio Arriba County, New Mexico
- 25no bedroom
- 2441 bedroom
- 2,3862 bedrooms
- 7,2553 bedrooms
- 1,6554 bedrooms
- 3705+ bedrooms
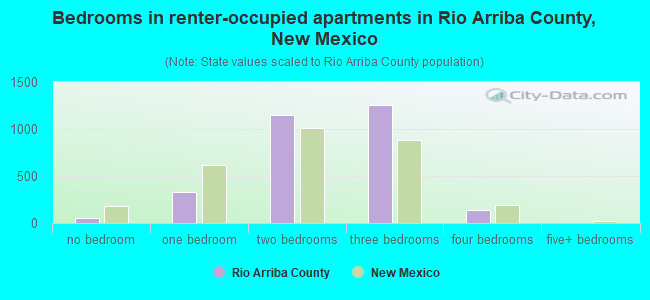
- Bedrooms in renter-occupied apartments in Rio Arriba County, New Mexico
- 48no bedroom
- 3341 bedroom
- 9392 bedrooms
- 1,3533 bedrooms
- 1294 bedrooms
- 75+ bedrooms
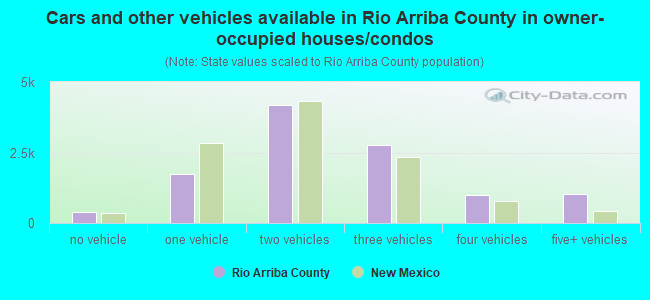
- Cars and other vehicles available in Rio Arriba County in owner-occupied houses/condos
- 282no vehicle
- 2,0681 vehicle
- 4,0702 vehicles
- 3,1853 vehicles
- 1,1824 vehicles
- 1,2475+ vehicles
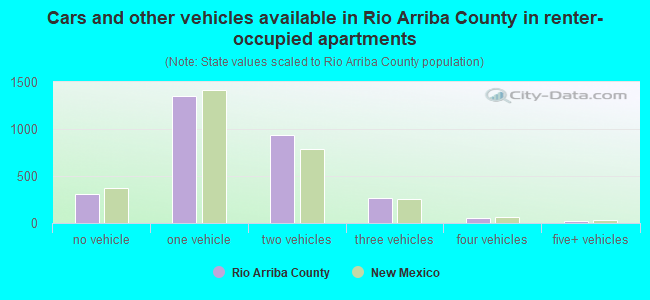
- Cars and other vehicles available in Rio Arriba County in renter-occupied apartments
- 214no vehicle
- 1,5101 vehicle
- 8242 vehicles
- 2393 vehicles
- 714 vehicles
- 175+ vehicles
96.0% of Rio Arriba County residents lived in the same house 1 years ago.
Out of people who lived in different houses, 15% lived in this county.
Out of people who lived in different counties, 75% lived in New Mexico.
| Rio Arriba County: | 96.0% |
| State average: | 88.2% |
Place of birth for U.S.-born residents:
- This state: 31,264
- Other state: 6,300
- Northeast: 809
- Midwest: 789
- South: 1,199
- West: 3,534
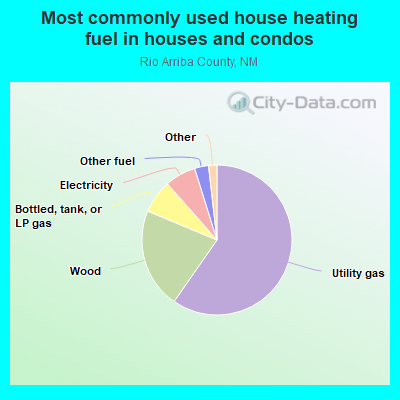
- 57.0%Utility gas
- 23.1%Wood
- 7.9%Electricity
- 6.4%Bottled, tank, or LP gas
- 4.0%Other fuel
- 0.7%Fuel oil, kerosene, etc.
- 0.7%Solar energy
- 0.1%No fuel used
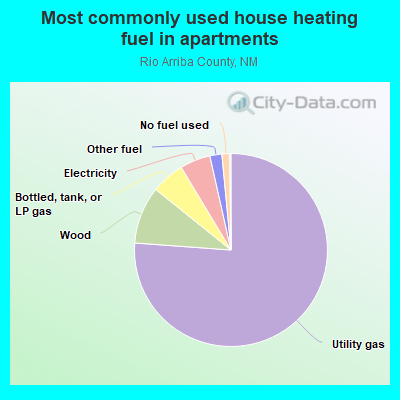
- 71.8%Utility gas
- 10.3%Wood
- 7.5%Bottled, tank, or LP gas
- 5.6%Electricity
- 2.7%Other fuel
- 1.2%No fuel used
- 0.8%Fuel oil, kerosene, etc.
- 0.2%Coal or coke
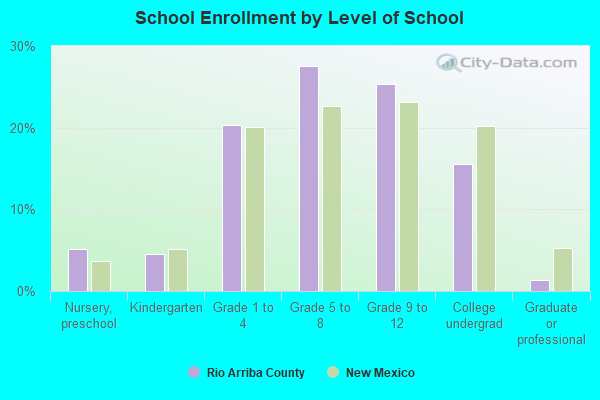
Private vs. public school enrollment:
| Here: | 6.0% |
| New Mexico: | 10.2% |
| Here: | 17.9% |
| New Mexico: | 10.0% |
| Here: | 13.5% |
| New Mexico: | 12.3% |


Rio Arriba County government finances - Expenditure in 2018:
- Charges - Other: $469,000
Hospital Public: $149,000
Hospital Public: $87,000
Other: $2,000
Parks and Recreation: $1,000
- Construction - Central Staff Services: $4,182,000
Regular Highways: $1,056,000
Health - Other: $781,000
Local Fire Protection: $366,000
Parks and Recreation: $187,000
Central Staff Services: $180,000
Parks and Recreation: $142,000
Regular Highways: $117,000
Public Welfare - Other: $37,000
General Public Buildings: $15,000
Police Protection: $5,000
Solid Waste Management: $1,000
- Current Operations - Central Staff Services: $6,022,000
Correctional Institutions: $4,697,000
Correctional Institutions: $4,543,000
Health - Other: $4,258,000
Local Fire Protection: $3,808,000
Public Welfare - Other: $3,640,000
Police Protection: $3,625,000
Central Staff Services: $3,331,000
Police Protection: $3,056,000
Financial Administration: $2,872,000
Financial Administration: $2,449,000
Regular Highways: $2,156,000
General Public Buildings: $1,764,000
Health - Other: $1,413,000
General Public Buildings: $1,356,000
Regular Highways: $1,239,000
Local Fire Protection: $802,000
Transit Utilities: $486,000
Parks and Recreation: $432,000
Parks and Recreation: $341,000
Solid Waste Management: $338,000
Judicial and Legal Services: $31,000
Judicial and Legal Services: $27,000
Corrections - Other: $23,000
Water Utilities: $21,000
Libraries: $7,000
Libraries: $7,000
- Federal Intergovernmental - Other: $1,143,000
Natural Resources: $879,000
Natural Resources: $828,000
Public Welfare: $245,000
Other: $186,000
- Miscellaneous - General Revenue - Other: $11,246,000
General Revenue - Other: $4,157,000
Royalties: $3,130,000
Interest Earnings: $360,000
Rents: $313,000
Rents: $218,000
Donations From Private Sources: $91,000
Donations From Private Sources: $39,000
Sale of Property: $15,000
Sale of Property: $1,000
- Other Capital Outlay - Central Staff Services: $969,000
Local Fire Protection: $762,000
Health - Other: $733,000
Police Protection: $431,000
Local Fire Protection: $416,000
Health - Other: $138,000
Public Welfare - Other: $119,000
Central Staff Services: $67,000
Police Protection: $48,000
Libraries: $7,000
Financial Administration: $2,000
- State Intergovernmental - Other: $8,415,000
Public Welfare: $2,628,000
Other: $982,000
Health and Hospitals: $911,000
General Local Government Support: $243,000
General Local Government Support: $232,000
Health and Hospitals: $193,000
Highways: $114,000
Public Welfare: $60,000
- Tax - Property: $11,919,000
General Sales and Gross Receipts: $7,255,000
Property: $6,634,000
General Sales and Gross Receipts: $5,736,000
Motor Vehicle License: $638,000
Motor Vehicle License: $627,000
Other Selective Sales: $326,000
Occupation and Business License - Other: $140,000
Other License: $92,000
Other Selective Sales: $82,000
Occupation and Business License - Other: $30,000
Alcoholic Beverage License: $5,000
Alcoholic Beverage License: $4,000
- Total Salaries and Wages: $10,659,000
: $9,360,000
Rio Arriba County government finances - Revenue in 2018:
- Charges - Other: $469,000
Hospital Public: $149,000
Hospital Public: $87,000
Other: $2,000
Parks and Recreation: $1,000
- Construction - Central Staff Services: $4,182,000
Regular Highways: $1,056,000
Health - Other: $781,000
Local Fire Protection: $366,000
Parks and Recreation: $187,000
Central Staff Services: $180,000
Parks and Recreation: $142,000
Regular Highways: $117,000
Public Welfare - Other: $37,000
General Public Buildings: $15,000
Police Protection: $5,000
Solid Waste Management: $1,000
- Current Operations - Central Staff Services: $6,022,000
Correctional Institutions: $4,697,000
Correctional Institutions: $4,543,000
Health - Other: $4,258,000
Local Fire Protection: $3,808,000
Public Welfare - Other: $3,640,000
Police Protection: $3,625,000
Central Staff Services: $3,331,000
Police Protection: $3,056,000
Financial Administration: $2,872,000
Financial Administration: $2,449,000
Regular Highways: $2,156,000
General Public Buildings: $1,764,000
Health - Other: $1,413,000
General Public Buildings: $1,356,000
Regular Highways: $1,239,000
Local Fire Protection: $802,000
Transit Utilities: $486,000
Parks and Recreation: $432,000
Parks and Recreation: $341,000
Solid Waste Management: $338,000
Judicial and Legal Services: $31,000
Judicial and Legal Services: $27,000
Corrections - Other: $23,000
Water Utilities: $21,000
Libraries: $7,000
Libraries: $7,000
- Federal Intergovernmental - Other: $1,143,000
Natural Resources: $879,000
Natural Resources: $828,000
Public Welfare: $245,000
Other: $186,000
- Miscellaneous - General Revenue - Other: $11,246,000
General Revenue - Other: $4,157,000
Royalties: $3,130,000
Interest Earnings: $360,000
Rents: $313,000
Rents: $218,000
Donations From Private Sources: $91,000
Donations From Private Sources: $39,000
Sale of Property: $15,000
Sale of Property: $1,000
- Other Capital Outlay - Central Staff Services: $969,000
Local Fire Protection: $762,000
Health - Other: $733,000
Police Protection: $431,000
Local Fire Protection: $416,000
Health - Other: $138,000
Public Welfare - Other: $119,000
Central Staff Services: $67,000
Police Protection: $48,000
Libraries: $7,000
Financial Administration: $2,000
- State Intergovernmental - Other: $8,415,000
Public Welfare: $2,628,000
Other: $982,000
Health and Hospitals: $911,000
General Local Government Support: $243,000
General Local Government Support: $232,000
Health and Hospitals: $193,000
Highways: $114,000
Public Welfare: $60,000
- Tax - Property: $11,919,000
General Sales and Gross Receipts: $7,255,000
Property: $6,634,000
General Sales and Gross Receipts: $5,736,000
Motor Vehicle License: $638,000
Motor Vehicle License: $627,000
Other Selective Sales: $326,000
Occupation and Business License - Other: $140,000
Other License: $92,000
Other Selective Sales: $82,000
Occupation and Business License - Other: $30,000
Alcoholic Beverage License: $5,000
Alcoholic Beverage License: $4,000
- Total Salaries and Wages: $10,659,000
: $9,360,000
Rio Arriba County government finances - Debt in 2018:
- Charges - Other: $469,000
Hospital Public: $149,000
Hospital Public: $87,000
Other: $2,000
Parks and Recreation: $1,000
- Construction - Central Staff Services: $4,182,000
Regular Highways: $1,056,000
Health - Other: $781,000
Local Fire Protection: $366,000
Parks and Recreation: $187,000
Central Staff Services: $180,000
Parks and Recreation: $142,000
Regular Highways: $117,000
Public Welfare - Other: $37,000
General Public Buildings: $15,000
Police Protection: $5,000
Solid Waste Management: $1,000
- Current Operations - Central Staff Services: $6,022,000
Correctional Institutions: $4,697,000
Correctional Institutions: $4,543,000
Health - Other: $4,258,000
Local Fire Protection: $3,808,000
Public Welfare - Other: $3,640,000
Police Protection: $3,625,000
Central Staff Services: $3,331,000
Police Protection: $3,056,000
Financial Administration: $2,872,000
Financial Administration: $2,449,000
Regular Highways: $2,156,000
General Public Buildings: $1,764,000
Health - Other: $1,413,000
General Public Buildings: $1,356,000
Regular Highways: $1,239,000
Local Fire Protection: $802,000
Transit Utilities: $486,000
Parks and Recreation: $432,000
Parks and Recreation: $341,000
Solid Waste Management: $338,000
Judicial and Legal Services: $31,000
Judicial and Legal Services: $27,000
Corrections - Other: $23,000
Water Utilities: $21,000
Libraries: $7,000
Libraries: $7,000
- Federal Intergovernmental - Other: $1,143,000
Natural Resources: $879,000
Natural Resources: $828,000
Public Welfare: $245,000
Other: $186,000
- Miscellaneous - General Revenue - Other: $11,246,000
General Revenue - Other: $4,157,000
Royalties: $3,130,000
Interest Earnings: $360,000
Rents: $313,000
Rents: $218,000
Donations From Private Sources: $91,000
Donations From Private Sources: $39,000
Sale of Property: $15,000
Sale of Property: $1,000
- Other Capital Outlay - Central Staff Services: $969,000
Local Fire Protection: $762,000
Health - Other: $733,000
Police Protection: $431,000
Local Fire Protection: $416,000
Health - Other: $138,000
Public Welfare - Other: $119,000
Central Staff Services: $67,000
Police Protection: $48,000
Libraries: $7,000
Financial Administration: $2,000
- State Intergovernmental - Other: $8,415,000
Public Welfare: $2,628,000
Other: $982,000
Health and Hospitals: $911,000
General Local Government Support: $243,000
General Local Government Support: $232,000
Health and Hospitals: $193,000
Highways: $114,000
Public Welfare: $60,000
- Tax - Property: $11,919,000
General Sales and Gross Receipts: $7,255,000
Property: $6,634,000
General Sales and Gross Receipts: $5,736,000
Motor Vehicle License: $638,000
Motor Vehicle License: $627,000
Other Selective Sales: $326,000
Occupation and Business License - Other: $140,000
Other License: $92,000
Other Selective Sales: $82,000
Occupation and Business License - Other: $30,000
Alcoholic Beverage License: $5,000
Alcoholic Beverage License: $4,000
- Total Salaries and Wages: $10,659,000
: $9,360,000
Rio Arriba County government finances - Cash and Securities in 2018:
- Charges - Other: $469,000
Hospital Public: $149,000
Hospital Public: $87,000
Other: $2,000
Parks and Recreation: $1,000
- Construction - Central Staff Services: $4,182,000
Regular Highways: $1,056,000
Health - Other: $781,000
Local Fire Protection: $366,000
Parks and Recreation: $187,000
Central Staff Services: $180,000
Parks and Recreation: $142,000
Regular Highways: $117,000
Public Welfare - Other: $37,000
General Public Buildings: $15,000
Police Protection: $5,000
Solid Waste Management: $1,000
- Current Operations - Central Staff Services: $6,022,000
Correctional Institutions: $4,697,000
Correctional Institutions: $4,543,000
Health - Other: $4,258,000
Local Fire Protection: $3,808,000
Public Welfare - Other: $3,640,000
Police Protection: $3,625,000
Central Staff Services: $3,331,000
Police Protection: $3,056,000
Financial Administration: $2,872,000
Financial Administration: $2,449,000
Regular Highways: $2,156,000
General Public Buildings: $1,764,000
Health - Other: $1,413,000
General Public Buildings: $1,356,000
Regular Highways: $1,239,000
Local Fire Protection: $802,000
Transit Utilities: $486,000
Parks and Recreation: $432,000
Parks and Recreation: $341,000
Solid Waste Management: $338,000
Judicial and Legal Services: $31,000
Judicial and Legal Services: $27,000
Corrections - Other: $23,000
Water Utilities: $21,000
Libraries: $7,000
Libraries: $7,000
- Federal Intergovernmental - Other: $1,143,000
Natural Resources: $879,000
Natural Resources: $828,000
Public Welfare: $245,000
Other: $186,000
- Miscellaneous - General Revenue - Other: $11,246,000
General Revenue - Other: $4,157,000
Royalties: $3,130,000
Interest Earnings: $360,000
Rents: $313,000
Rents: $218,000
Donations From Private Sources: $91,000
Donations From Private Sources: $39,000
Sale of Property: $15,000
Sale of Property: $1,000
- Other Capital Outlay - Central Staff Services: $969,000
Local Fire Protection: $762,000
Health - Other: $733,000
Police Protection: $431,000
Local Fire Protection: $416,000
Health - Other: $138,000
Public Welfare - Other: $119,000
Central Staff Services: $67,000
Police Protection: $48,000
Libraries: $7,000
Financial Administration: $2,000
- State Intergovernmental - Other: $8,415,000
Public Welfare: $2,628,000
Other: $982,000
Health and Hospitals: $911,000
General Local Government Support: $243,000
General Local Government Support: $232,000
Health and Hospitals: $193,000
Highways: $114,000
Public Welfare: $60,000
- Tax - Property: $11,919,000
General Sales and Gross Receipts: $7,255,000
Property: $6,634,000
General Sales and Gross Receipts: $5,736,000
Motor Vehicle License: $638,000
Motor Vehicle License: $627,000
Other Selective Sales: $326,000
Occupation and Business License - Other: $140,000
Other License: $92,000
Other Selective Sales: $82,000
Occupation and Business License - Other: $30,000
Alcoholic Beverage License: $5,000
Alcoholic Beverage License: $4,000
- Total Salaries and Wages: $10,659,000
: $9,360,000
Supplemental Security Income (SSI) in 2006:
- Total number of recipients: 1,613
- Number of aged recipients: 230
- Number of blind and disabled recipients: 1,383
- Number of recipients under 18: 153
- Number of recipients between 18 and 64: 994
- Number of recipients older than 64: 466
- Number of recipients also receiving OASDI: 692
- Amount of payments (thousands of dollars): 658
| Most common first names in Rio Arriba County, NM among deceased individuals | ||
| Name | Count | Lived (average) |
|---|---|---|
| Jose | 235 | 75.3 years |
| Joe | 86 | 70.0 years |
| Juan | 84 | 77.4 years |
| Mary | 75 | 73.1 years |
| Maria | 70 | 80.9 years |
| Robert | 51 | 64.2 years |
| John | 49 | 66.1 years |
| Manuel | 49 | 70.1 years |
| Frank | 46 | 72.5 years |
| Antonio | 45 | 77.4 years |
| Most common last names in Rio Arriba County, NM among deceased individuals | ||
| Last name | Count | Lived (average) |
|---|---|---|
| Martinez | 641 | 69.6 years |
| Vigil | 210 | 73.0 years |
| Trujillo | 192 | 72.1 years |
| Montoya | 161 | 72.9 years |
| Garcia | 149 | 70.1 years |
| Salazar | 134 | 69.7 years |
| Romero | 106 | 72.2 years |
| Gallegos | 104 | 72.9 years |
| Maestas | 104 | 71.3 years |
| Sanchez | 97 | 71.9 years |
| Businesses in Rio Arriba County, NM | ||||
| Name | Count | Name | Count | |
|---|---|---|---|---|
| Best Western | 1 | True Value | 1 | |
| SONIC Drive-In | 1 | U-Haul | 1 | |
Rio Arriba County on our top lists:
- #58 on the list of "Top 101 counties with highest percentage of residents voting for Obama (Democrat) in the 2012 Presidential Election"
- #88 on the list of "Top 101 counties with the most Catholic congregations"