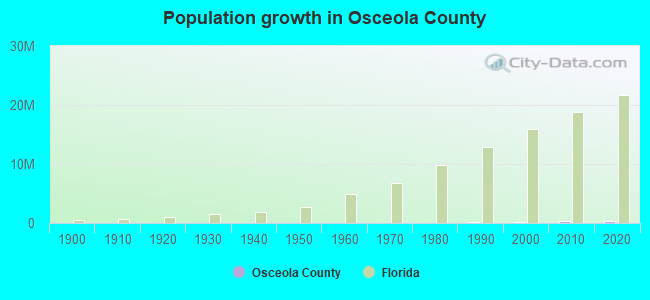
Osceola County, Florida (FL)
County owner-occupied free and clear houses and condos in 2010: 12,980
County owner-occupied houses and condos in 2000: 41,315
Renter-occupied apartments: 32,062 (it was 19,662 in 2000)
| % of renters here: | 32% |
| State: | 33% |
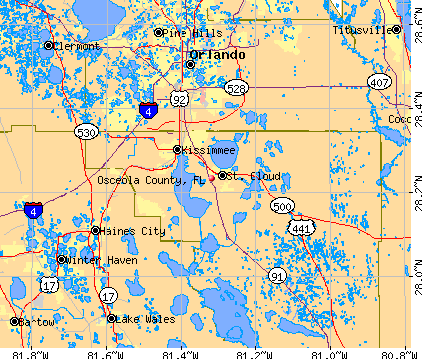
Land area: 1322 sq. mi.
Water area: 184.5 sq. mi.
Population density: 320 people per square mile (high).
Industries providing employment: Arts, entertainment, recreation, accommodation and food services (17.8%), Educational, health and social services (16.1%), Retail trade (14.3%), Professional, scientific, management, administrative, and waste management services (11.6%).
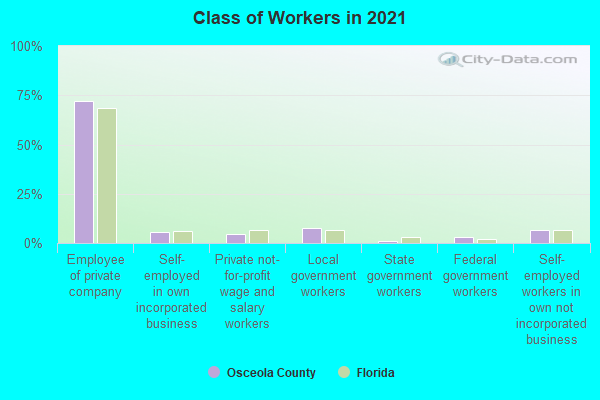
Type of workers:
- Private wage or salary: 84%
- Government: 10%
- Self-employed, not incorporated: 5%
- Unpaid family work: 0%
- OSM Map
- General Map
- Google Map
- MSN Map

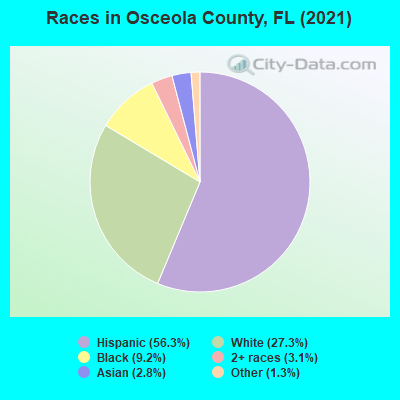
- 239,90756.8%Hispanic or Latino
- 113,43826.8%White Non-Hispanic Alone
- 42,09610.0%Black Non-Hispanic Alone
- 13,9693.3%Two or more races
- 10,4652.5%Asian alone
- 2,5420.6%Some other race alone
- 1280.03%American Indian and Alaska Native alone
| Median resident age: | 37.3 years |
| Florida median age: | 42.7 years |
| Males: 210,840 | |
| Females: 211,705 |


| Osceola County: | 2.0 people |
| Florida: | 2 people |
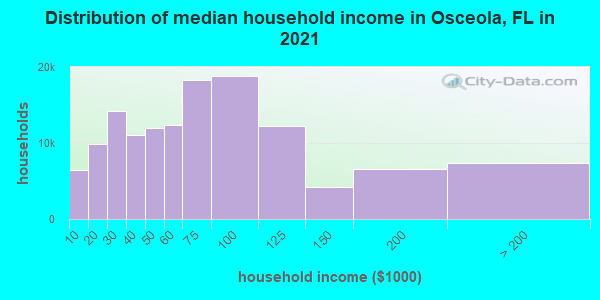
Estimated median household income in 2022: $63,271 ($38,214 in 1999)
| This county: | $63,271 |
| Florida: | $69,303 |
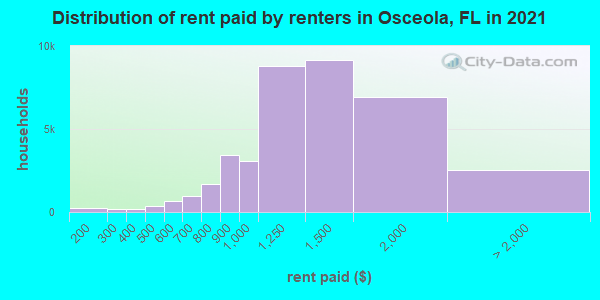
Median contract rent in 2022 for apartments: $1,456 (lower quartile is $1,072, upper quartile is $1,849)
| This county: | $1456 |
| State: | $1367 |
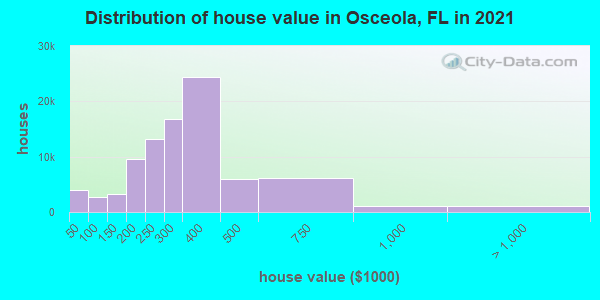
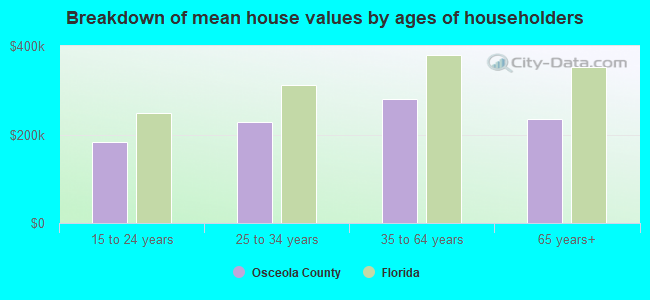
Estimated median house or condo value in 2022: $346,900 (it was $92,500 in 2000)
| Osceola: | $346,900 |
| Florida: | $354,100 |
Mean price in 2022:
Median monthly housing costs for homes and condos with a mortgage: $1,670Detached houses: $402,242
Here: $402,242 State: $500,941 Townhouses or other attached units: $291,172
Here: $291,172 State: $370,869 In 2-unit structures: $262,355
Here: $262,355 State: $423,188 In 3-to-4-unit structures: $245,189
Here: $245,189 State: $309,944 In 5-or-more-unit structures: $281,975
Here: $281,975 State: $447,145 Mobile homes: $142,430
Here: $142,430 State: $113,202 Occupied boats, RVs, vans, etc.: $73,547
Here: $73,547 State: $73,933
Median monthly housing costs for units without a mortgage: $568
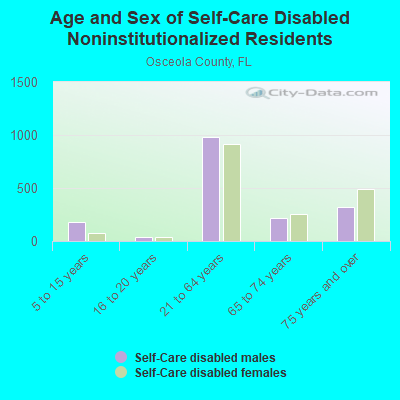
Institutionalized population: 2,636
Crime in 2020 (reported by the sheriff's office or county police, not the county total):
- Murders: 11
- Rapes: 76
- Robberies: 110
- Assaults: 535
- Burglaries: 797
- Thefts: 2893
- Auto thefts: 284
Crime in 2019 (reported by the sheriff's office or county police, not the county total):
- Murders: 9
- Rapes: 80
- Robberies: 86
- Assaults: 503
- Burglaries: 830
- Thefts: 3408
- Auto thefts: 271
Health of residents in Osceola County based on CDC Behavioral Risk Factor Surveillance System Survey Questionnaires from 2013 to 2021:
General health status score of residents in this county from 1 (poor) to 5 (excellent) is 3.4. This is about average.69.3% of residents exercised in the past month. This is less than average.
41.2% of residents smoked 100+ cigarettes in their lives. This is about average.
50.7% of adult residents drank alcohol in the past 30 days. This is less than average.
63.8% of residents visited a dentist within the past year. This is less than average.
Average weight of males is 194 pounds. This is about average.
Average weight of females is 160 pounds. This is about average.
Health of residents in Osceola County based on CDC Behavioral Risk Factor Surveillance System Survey Questionnaires from 2003 to 2012:
General health status score of residents in this county from 1 (poor) to 5 (excellent) is 3.3. This is worse than average.69.8% of residents exercised in the past month. This is less than average.
48.0% of residents smoked 100+ cigarettes in their lives. This is about average.
99.1% of adult residents drank alcohol in the past 30 days. This is more than average.
59.5% of residents visited a dentist within the past year. This is less than average.
Average weight of males is 196 pounds. This is about average.
Average weight of females is 161 pounds. This is about average.
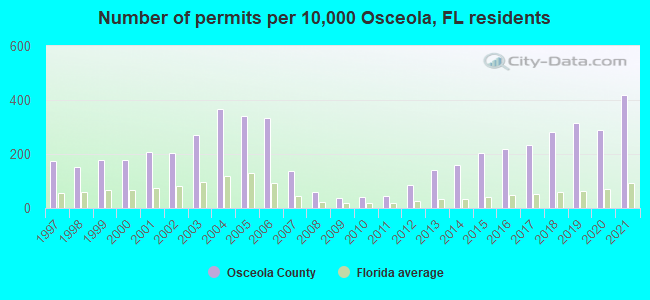
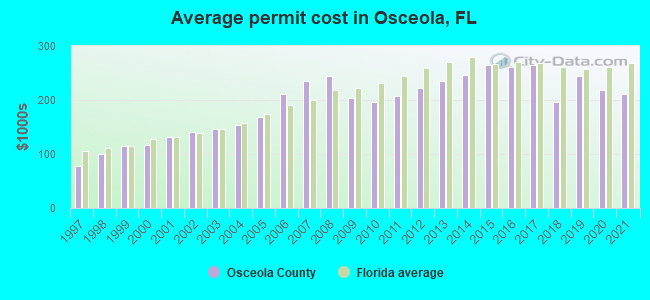
Single-family new house construction building permits:
- 2022: 6005 buildings, average cost: $202,500
- 2021: 7207 buildings, average cost: $210,800
- 2020: 4970 buildings, average cost: $218,700
- 2019: 5428 buildings, average cost: $243,800
- 2018: 4831 buildings, average cost: $196,000
- 2017: 4028 buildings, average cost: $264,500
- 2016: 3796 buildings, average cost: $261,100
- 2015: 3502 buildings, average cost: $264,300
- 2014: 2766 buildings, average cost: $246,000
- 2013: 2403 buildings, average cost: $235,700
- 2012: 1479 buildings, average cost: $223,400
- 2011: 785 buildings, average cost: $207,500
- 2010: 713 buildings, average cost: $197,300
- 2009: 635 buildings, average cost: $204,200
- 2008: 1033 buildings, average cost: $243,600
- 2007: 2389 buildings, average cost: $235,300
- 2006: 5772 buildings, average cost: $210,500
- 2005: 5841 buildings, average cost: $167,800
- 2004: 6316 buildings, average cost: $152,900
- 2003: 4692 buildings, average cost: $146,300
- 2002: 3541 buildings, average cost: $141,200
- 2001: 3561 buildings, average cost: $131,300
- 2000: 3061 buildings, average cost: $117,300
- 1999: 3042 buildings, average cost: $114,100
- 1998: 2613 buildings, average cost: $99,700
- 1997: 2995 buildings, average cost: $76,800
Median real estate property taxes paid for housing units with mortgages in 2022: $2,524 (0.7%)
Median real estate property taxes paid for housing units with no mortgage in 2022: $2,322 (0.8%)
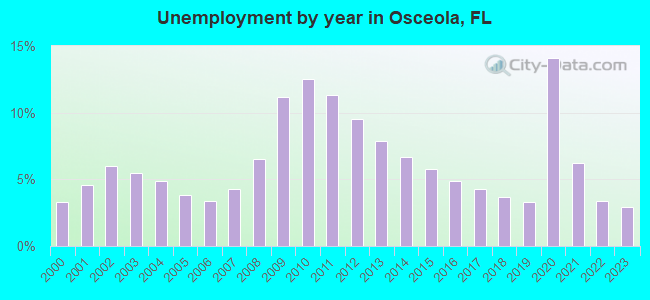
| Osceola County: | 13.5% |
| Florida: | 12.7% |
Median age of residents in 2022: 37.3 years old
(Males: 36.4 years old, Females: 38.0 years old)
(Median age for: White residents: 43.0 years old, Black residents: 35.1 years old, American Indian residents: 29.7 years old, Asian residents: 39.1 years old, Hispanic or Latino residents: 35.0 years old, Other race residents: 37.1 years old)
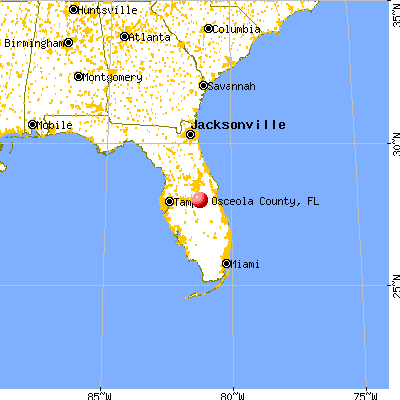
Area name: Orlando, FL MSA
Fair market rent in 2006 for a 1-bedroom apartment in Osceola County is $684 a month.
Fair market rent for a 2-bedroom apartment is $782 a month.
Fair market rent for a 3-bedroom apartment is $979 a month.
Cities in this county include: Kissimmee, Buenaventura Lakes, Yeehaw Junction, St. Cloud, Poinciana, South and East Osceola, Celebration, Campbell.
| Zip Code | City | Certified Residential Database | Mandatory Residential Database | Mandatory Non-Residential Database | |||
|---|---|---|---|---|---|---|---|
| Buildings Measured | Above 4 pCi/L (%) | Buildings Measured | Above 4 pCi/L (%) | Buildings Measured | Above 4 pCi/L (%) | ||
| 34739 | Kenansville | 1 | 0 | - | - | - | - |
| 34741 | Kissimmee | 58 | 0 | 1 | 0 | 1 | 0 |
| 34743 | Kissimmee | 9 | 0 | - | - | - | - |
| 34744 | Kissimmee | 52 | 0 | 2 | 0 | 2 | 0 |
| 34746 | Kissimmee | 13 | 0 | 1 | 0 | 1 | 0 |
| 34747 | Kissimmee | 31 | 0 | - | - | - | - |
| 34758 | Kissimmee | 6 | 0 | - | - | - | - |
| 34769 | Saint Cloud | 15 | 0 | 2 | 0 | 2 | 0 |
| 34770 | Saint Cloud | - | - | 1 | 0 | 1 | 0 |
| 34771 | Saint Cloud | 25 | 0 | - | - | - | - |
| 34772 | Saint Cloud | 7 | 0 | 1 | 0 | 1 | 0 |
Neighboring counties: Aransas County, Texas  , McMullen County, Texas , Webb County, Texas .
| Here: | 3.4% |
| Florida: | 2.9% |
Current college students: 7,092
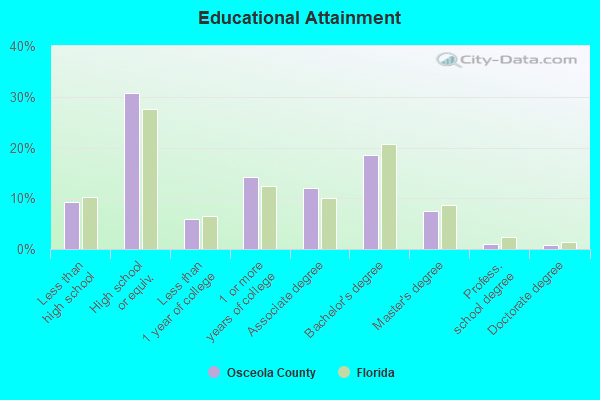
People 25 years of age or older with a high school degree or higher: 89.4%
People 25 years of age or older with a bachelor's degree or higher: 29.4%
Number of foreign born residents: 109,010 (50.9% naturalized citizens)
| Osceola County: | 25.8% |
| Whole state: | 21.7% |
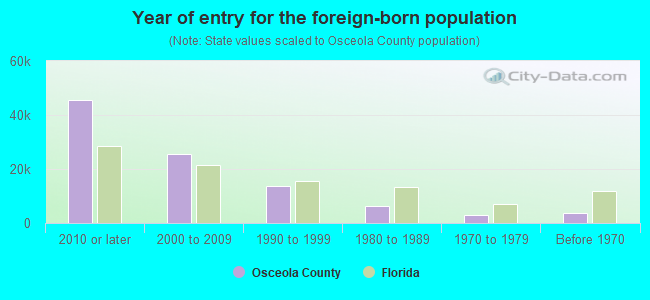
- Year of entry for the foreign-born population
- 55,2902010 or later
- 15,8502000 to 2009
- 17,3681990 to 1999
- 6,4771980 to 1989
- 2,7841970 to 1979
- 3,792Before 1970
Mean travel time to work (commute): " minutes
Percentage of county residents living and working in this county: 99.1%
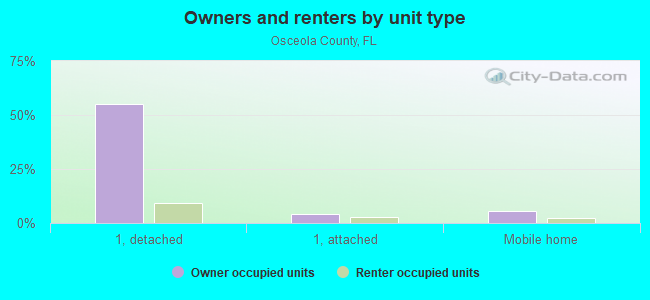
Housing units in structures:
- One, detached: 107,141
- One, attached: 16,039
- Two: 1,978
- 3 or 4: 3,243
- 5 to 9: 8,116
- 10 to 19: 13,625
- 20 to 49: 5,477
- 50 or more: 4,624
- Mobile homes: 10,917
- Boats, RVs, vans, etc.: 1,014
Housing units in Osceola County with a mortgage: 67,526 (3,187 second mortgage, 0 home equity loan, 1,901 both second mortgage and home equity loan)
Houses without a mortgage: 1,632
| Here: | 98.5% with mortgage |
| State: | 97.6% with mortgage |
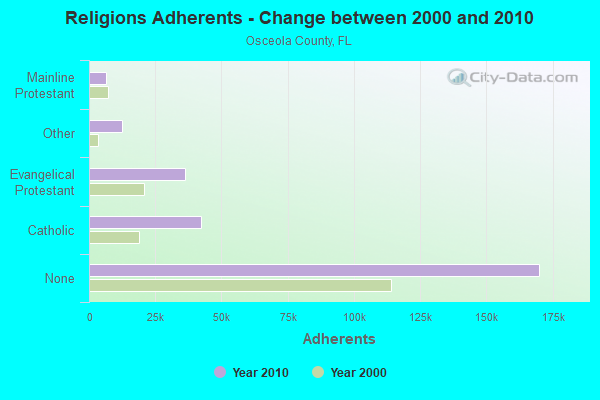
Religion statistics for Osceola County
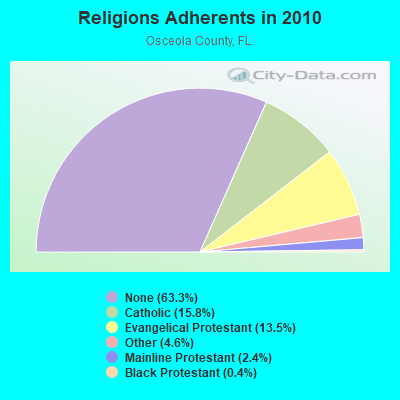
| Religion | Adherents | Congregations |
|---|---|---|
| Catholic | 42,412 | 6 |
| Evangelical Protestant | 36,206 | 152 |
| Other | 12,323 | 24 |
| Mainline Protestant | 6,533 | 15 |
| Black Protestant | 948 | 7 |
| Orthodox | 230 | 2 |
| None | 170,033 | - |
Source: Clifford Grammich, Kirk Hadaway, Richard Houseal, Dale E.Jones, Alexei Krindatch, Richie Stanley and Richard H.Taylor. 2012. 2010 U.S.Religion Census: Religious Congregations & Membership Study. Association of Statisticians of American Religious Bodies. Jones, Dale E., et al. 2002. Congregations and Membership in the United States 2000. Nashville, TN: Glenmary Research Center.
Food Environment Statistics:
| Osceola County: | 2.35 / 10,000 pop. |
| State: | 2.04 / 10,000 pop. |
| Here: | 0.23 / 10,000 pop. |
| Florida: | 0.11 / 10,000 pop. |
| This county: | 0.94 / 10,000 pop. |
| Florida: | 1.28 / 10,000 pop. |
| Osceola County: | 2.97 / 10,000 pop. |
| Florida: | 3.04 / 10,000 pop. |
| This county: | 7.39 / 10,000 pop. |
| State: | 7.45 / 10,000 pop. |
| Osceola County: | 9.3% |
| Florida: | 9.2% |
| Osceola County: | 25.1% |
| State: | 23.7% |
| Here: | 15.5% |
| State: | 14.0% |
Agriculture in Osceola County:
Average size of farms: 1258 acresAverage value of agricultural products sold per farm: $125,128
Average value of crops sold per acre for harvested cropland: $1601.33
The value of nursery, greenhouse, floriculture, and sod as a percentage of the total market value of agricultural products sold: 29.71%
The value of livestock, poultry, and their products as a percentage of the total market value of agricultural products sold: 32.32%
Average total farm production expenses per farm: $113,450
Harvested cropland as a percentage of land in farms: 4.21%
Irrigated harvested cropland as a percentage of land in farms: 65.11%
Average market value of all machinery and equipment per farm: $72,904
The percentage of farms operated by a family or individual: 84.78%
Average age of principal farm operators: 58 years
Average number of cattle and calves per 100 acres of all land in farms: 15.30
Milk cows as a percentage of all cattle and calves: 0.01%
Vegetables: 1,098 harvested acres
Land in orchards: 11,063 acres
Earthquake activity:
Osceola County-area historical earthquake activity is significantly above Florida state average. It is 90% smaller than the overall U.S. average.On 9/10/2006 at 14:56:08, a magnitude 5.9 (5.9 MB, 5.5 MS, 5.8 MW, Class: Moderate, Intensity: VI - VII) earthquake occurred 354.1 miles away from Osceola County center
On 6/23/2016 at 17:20:29, a magnitude 3.8 (3.8 ML, Class: Light, Intensity: II - III) earthquake occurred 166.3 miles away from the county center
On 9/4/2016 at 18:29:29, a magnitude 3.8 (3.8 ML) earthquake occurred 167.8 miles away from the county center
On 9/21/2016 at 16:30:52, a magnitude 3.8 (3.8 ML) earthquake occurred 168.1 miles away from the county center
On 11/22/1974 at 05:25:55, a magnitude 4.7 (4.7 MB, Class: Light, Intensity: IV - V) earthquake occurred 330.4 miles away from Osceola County center
On 7/16/2016 at 20:00:10, a magnitude 3.7 (3.7 MB) earthquake occurred 155.7 miles away from the county center
Magnitude types: body-wave magnitude (MB), local magnitude (ML), surface-wave magnitude (MS), moment magnitude (MW)
Most recent natural disasters:
- Florida Covid-19 Pandemic, Incident Period: January 20, 2020, FEMA Id: 4486, Natural disaster type: Other
- Florida Hurricane Dorian, Incident Period: August 28, 2019 - September 9, 2019, FEMA Id: 4468, Natural disaster type: Hurricane
- Florida Hurricane Irma, Incident Period: September 4, 2017 - October 18, 2017, FEMA Id: 4337, Natural disaster type: Hurricane
- Florida Hurricane Matthew, Incident Period: October 03, 2016 to October 19, 2016, Emergency Declared EM-3377: October 06, 2016, FEMA Id: 3377, Natural disaster type: Hurricane
- Florida Hurricane Matthew, Incident Period: October 03, 2016 to October 19, 2016, Major Disaster (Presidential) Declared DR-4283: October 08, 2016, FEMA Id: 4283, Natural disaster type: Hurricane
- Florida Tropical Storm Fay, Incident Period: August 18, 2008 to September 12, 2008, Major Disaster (Presidential) Declared DR-1785: August 24, 2008, FEMA Id: 1785, Natural disaster type: Tropical Storm
- Florida Tropical Storm Fay, Incident Period: August 18, 2008 to September 12, 2008, Emergency Declared EM-3288: August 21, 2008, FEMA Id: 3288, Natural disaster type: Tropical Storm
- Florida Hurricane Wilma, Incident Period: October 23, 2005 to November 18, 2005, Major Disaster (Presidential) Declared DR-1609: October 24, 2005, FEMA Id: 1609, Natural disaster type: Hurricane
- Florida Hurricane Katrina Evacuation, Incident Period: August 29, 2005 to October 01, 2005, Emergency Declared EM-3220: September 05, 2005, FEMA Id: 3220, Natural disaster type: Hurricane
- Florida Hurricane Jeanne, Incident Period: September 24, 2004 to November 17, 2004, Major Disaster (Presidential) Declared DR-1561: September 26, 2004, FEMA Id: 1561, Natural disaster type: Hurricane
- 11 other natural disasters have been reported since 1953.
The number of natural disasters in Osceola County (21) is greater than the US average (15).
Major Disasters (Presidential) Declared: 10
Emergencies Declared: 5
Causes of natural disasters: Hurricanes: 12, Fires: 5, Tropical Storms: 3, Tornado: 1, Other: 1 (Note: some incidents may be assigned to more than one category).
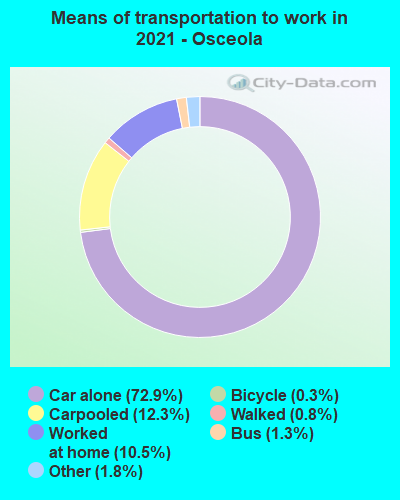
Means of transportation to work:
- Drove a car alone: 93,648 (65.4%)
- Carpooled: 18,108 (12.7%)
- Bus: 1,169 (0.8%)
- Long-distance train or commuter rail: 44 (0.0%)
- Taxicab, motorcycle, or other means: 2,738 (1.9%)
- Bicycle: 301 (0.2%)
- Walked: 1,353 (0.9%)
- Worked at home: 27,123 (18.9%)

- Health care and social assistance (18%)
- Retail trade (11%)
- Accommodation and food services (11%)
- Educational services (9%)
- Arts, entertainment, and recreation (7%)
- Administrative and support and waste management services (5%)
- Transportation and warehousing (5%)
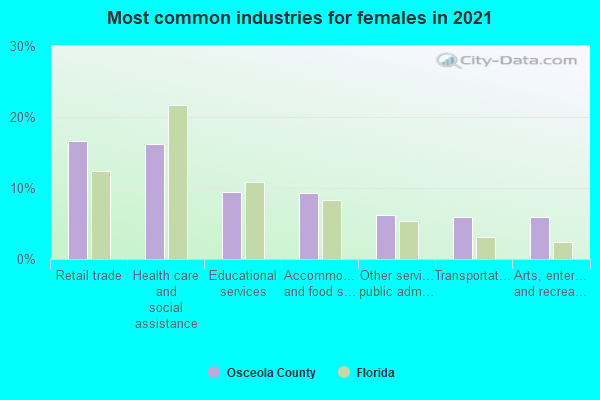
- Health care and social assistance (20%)
- Retail trade (12%)
- Accommodation and food services (12%)
- Educational services (10%)
- Arts, entertainment, and recreation (7%)
- Administrative and support and waste management services (6%)
- Transportation and warehousing (5%)
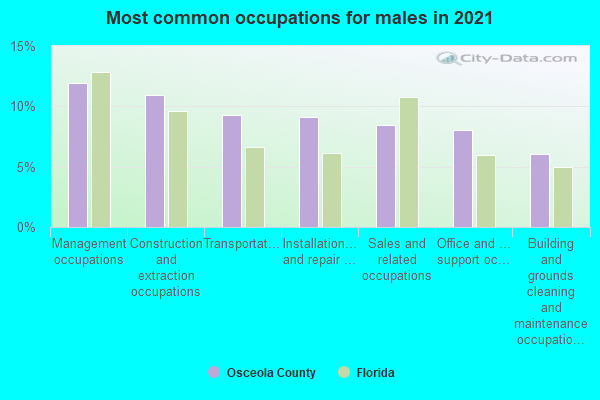
- Construction and extraction occupations (11%)
- Management occupations (10%)
- Office and administrative support occupations (8%)
- Sales and related occupations (8%)
- Transportation occupations (8%)
- Food preparation and serving related occupations (7%)
- Material moving occupations (6%)
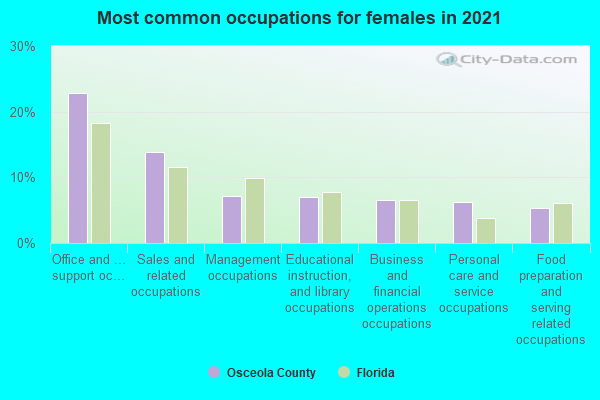
- Office and administrative support occupations (19%)
- Sales and related occupations (14%)
- Management occupations (8%)
- Educational instruction, and library occupations (8%)
- Food preparation and serving related occupations (7%)
- Personal care and service occupations (5%)
- Business and financial operations occupations (5%)
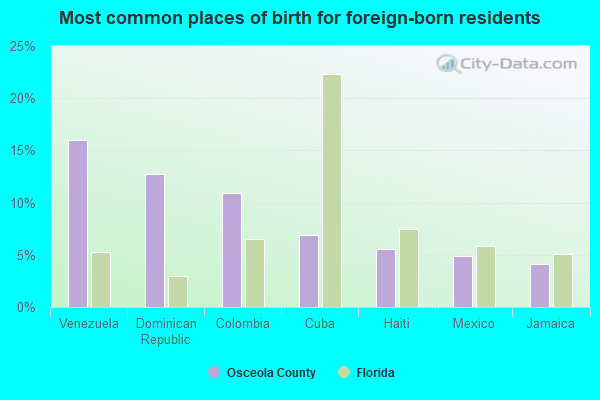
- Venezuela (22%)
- Dominican Republic (12%)
- Colombia (10%)
- Cuba (6%)
- Haiti (5%)
- Jamaica (4%)
- Brazil (3%)
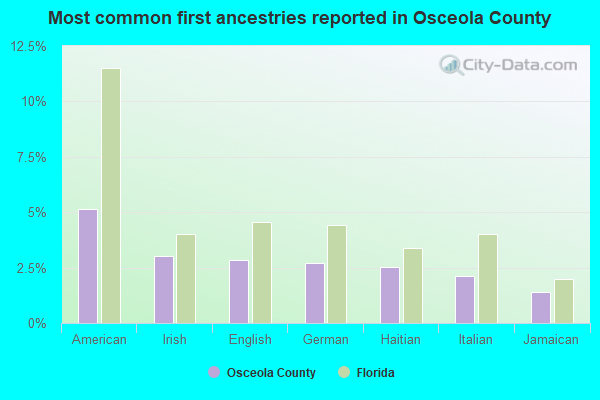
- American (4%)
- Irish (3%)
- Haitian (3%)
- English (3%)
- German (2%)
- Italian (2%)
- Jamaican (2%)
People in group quarters in Osceola County, Florida in 2010:
- 1,147 people in local jails and other municipal confinement facilities
- 1,025 people in nursing facilities/skilled-nursing facilities
- 294 people in correctional residential facilities
- 181 people in college/university student housing
- 173 people in other noninstitutional facilities
- 144 people in correctional facilities intended for juveniles
- 138 people in residential treatment centers for adults
- 89 people in emergency and transitional shelters (with sleeping facilities) for people experiencing homelessness
- 31 people in group homes intended for adults
- 26 people in group homes for juveniles (non-correctional)
- 14 people in workers' group living quarters and job corps centers
People in group quarters in Osceola County, Florida in 2000:
- 862 people in nursing homes
- 802 people in local jails and other confinement facilities (including police lockups)
- 189 people in other noninstitutional group quarters
- 155 people in college dormitories (includes college quarters off campus)
- 103 people in homes or halfway houses for drug/alcohol abuse
- 101 people in halfway houses
- 98 people in hospitals/wards and hospices for chronically ill
- 98 people in other hospitals or wards for chronically ill
- 48 people in homes for abused, dependent, and neglected children
- 18 people in other nonhousehold living situations
- 14 people in religious group quarters
- 10 people in mental (psychiatric) hospitals or wards
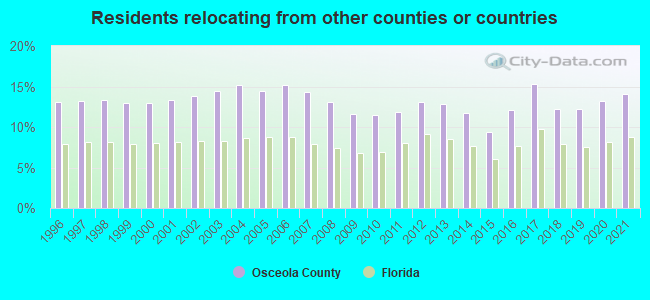
14.03% of this county's 2021 resident taxpayers lived in other counties in 2020 ($52,334 average adjusted gross income)
| Here: | 14.03% |
| Florida average: | 8.80% |
0.14% of residents moved from foreign countries ($302 average AGI)
Osceola County: 0.14% Florida average: 0.05%
9.11% relocated from other counties in Florida ($29,069 average AGI)
4.78% relocated from other states ($22,964 average AGI)
Osceola County: 4.78% Florida average: 4.38%
Top counties from which taxpayers relocated into this county between 2020 and 2021:
| from Orange County, FL | |
| from Polk County, FL | |
| from Miami-Dade County, FL | |
| from Broward County, FL | |
| from Seminole County, FL | |
| from Lake County, FL | |
| from Hillsborough County, FL |
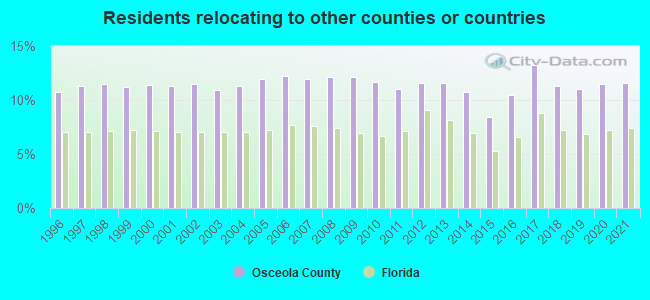
11.57% of this county's 2020 resident taxpayers moved to other counties in 2021 ($43,639 average adjusted gross income)
| Here: | 11.57% |
| Florida average: | 7.45% |
0.13% of residents moved to foreign countries ($313 average AGI)
Osceola County: 0.13% Florida average: 0.04%
8.55% relocated to other counties in Florida ($32,636 average AGI)
2.89% relocated to other states ($10,690 average AGI)
Osceola County: 2.89% Florida average: 2.97%
Top counties to which taxpayers relocated from this county between 2020 and 2021:
| to Orange County, FL | |
| to Polk County, FL | |
| to Lake County, FL | |
| to Seminole County, FL | |
| to Brevard County, FL | |
| to Hillsborough County, FL | |
| to Volusia County, FL |
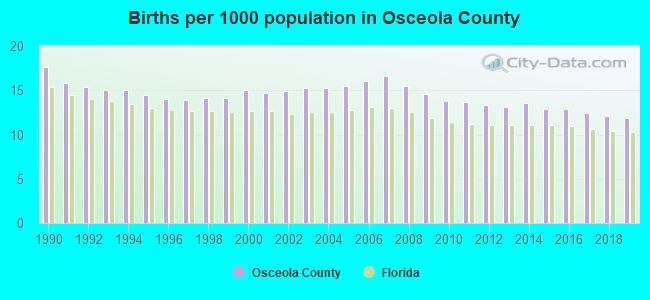
Births per 1000 population from 1990 to 1999: 14.9
Births per 1000 population from 2000 to 2009: 15.3
Births per 1000 population from 2010 to 2022: 10.9
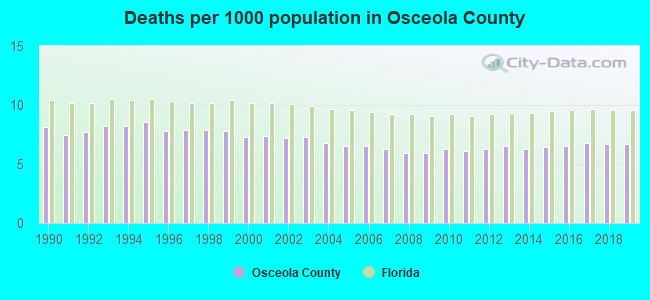
Deaths per 1000 population from 1990 to 1999: 8.0
Deaths per 1000 population from 2000 to 2009: 6.7
Deaths per 1000 population from 2010 to 2020: 6.6
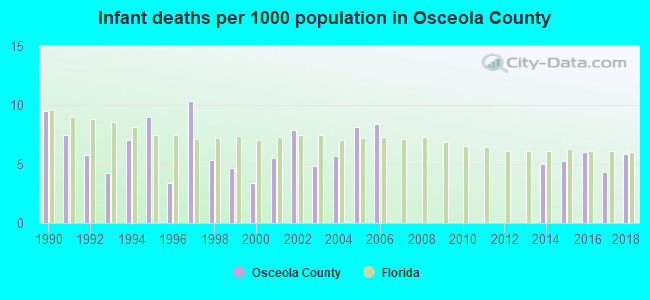
Infant deaths per 1000 live births from 1990 to 1999: 6.7
Infant deaths per 1000 live births from 2000 to 2009: 4.4
Infant deaths per 1000 live births from 2010 to 2021: 3.3
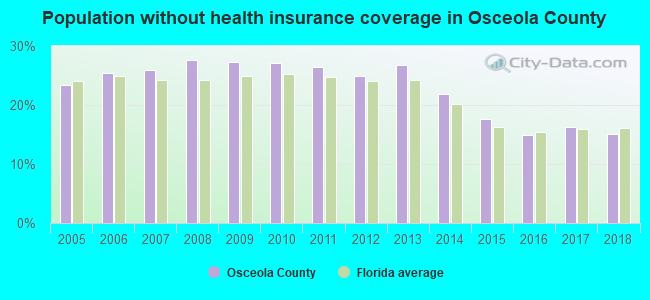
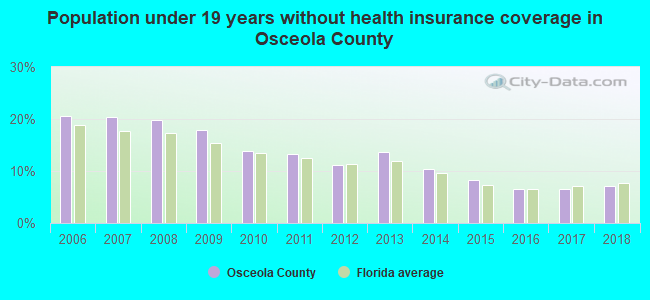
Persons under 19 years old without health insurance coverage in 2018: 7.2%
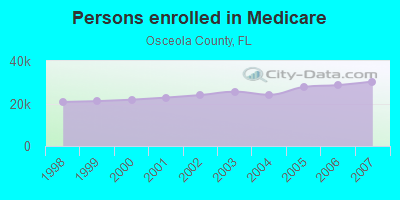
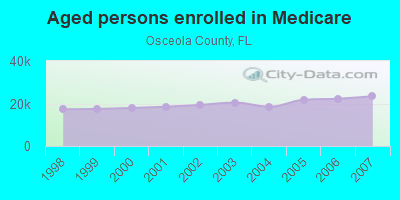
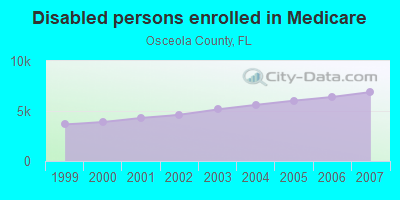
Persons enrolled in hospital insurance and/or supplemental medical insurance (Medicare) in July 1, 2007: 30,352 (23,457 aged, 6,895 disabled)
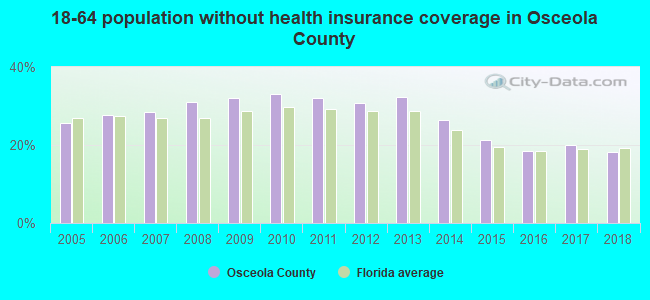
Children under 18 without health insurance coverage in 2007: 13,532 (20%)
Most common underlying causes of death in Osceola County, Florida in 1999 - 2019:
- Atherosclerotic heart disease (3,150)
- Bronchus or lung, unspecified - Malignant neoplasms (2,133)
- Acute myocardial infarction, unspecified (1,725)
- Chronic obstructive pulmonary disease, unspecified (1,653)
- Atherosclerotic cardiovascular disease, so described (1,206)
- Unspecified dementia (1,013)
- Stroke, not specified as haemorrhage or infarction (938)
- Alzheimer disease, unspecified (857)
- Breast, unspecified - Malignant neoplasms (684)
- Colon, unspecified - Malignant neoplasms (659)
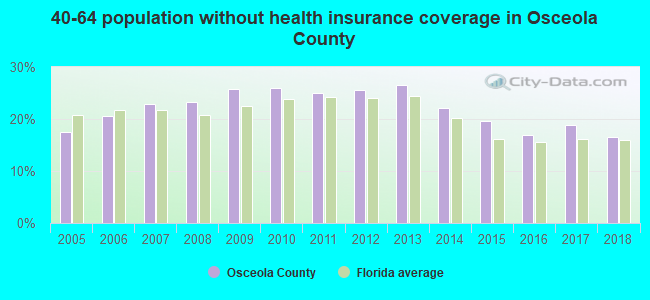
Population without health insurance coverage in 2000: 19%
Children under 18 without health insurance coverage in 2000: 19%
Short term general hospital admissions per 100,000 population in 2004: 6,755
Short term general hospital beds per 100,000 population in 2004: 136
Emergency room visits per 100,000 population in 2004: 28,945
General practice office based MDs per 100,000 population in 2005: 1,522
Medical specialist MDs per 100,000 population in 2005: 654
Dentists per 100,000 population in 1998: 6
Total births per 100,000 population, July 2005 - July 2006 : 21
Total deaths per 100,000 population, July 2005 - July 2006: 71
Limited-service eating places per 100,000 population in 2005 : 4
EPA green book nonattainment status in 2004-2006: 1
Homicides per 1,000,000 population from 2000 to 2006: 41.9. This is less than state average.
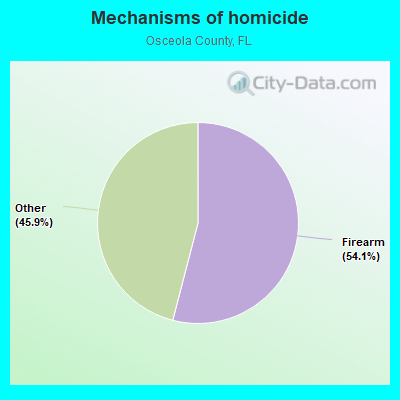
- Firearm - 22.7
- Other - 19.3
Suicides per 1,000,000 population from 2000 to 2006: 124.5. This is less than state average.
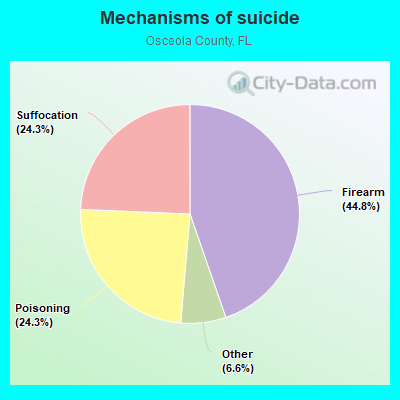
- Firearm - 55.7
- Poisoning - 30.3
- Suffocation - 30.3
- Other - 8.3
Household type by relationship:
Households: 422,545- Male householders: 74,759 (18,713 living alone), Female householders: 76,859 (18,148 living alone)
76,677 spouses (75,831 opposite-sex spouses), 10,756 unmarried partners, (10,266 opposite-sex unmarried partners), 128,999 children (119,781 natural, 4,086 adopted, 5,132 stepchildren), 8,307 grandchildren, 5,430 brothers or sisters, 12,569 parents, 499 foster children, 13,810 other relatives, 11,585 non-relatives
- In group quarters: 2,295
Size of family households: 34,105 2-persons, 26,912 3-persons, 23,370 4-persons, 12,332 5-persons, 4,667 6-persons, 3,218 7-or-more-persons.
Size of nonfamily households: 36,861 1-person, 8,936 2-persons, 545 3-persons, 600 4-persons, 72 5-persons.
64,024 married couples with children.
24,147 single-parent households (3,679 men, 20,468 women).
45.1% of residents of Osceola speak English at home.
48.0% of residents speak Spanish at home (59% speak English very well, 21% speak English well, 13% speak English not well, 7% don't speak English at all).
4.7% of residents speak other Indo-European language at home (71% speak English very well, 23% speak English well, 6% speak English not well, 1% don't speak English at all).
1.4% of residents speak Asian or Pacific Island language at home (74% speak English very well, 17% speak English well, 9% speak English not well).
0.8% of residents speak other language at home (63% speak English very well, 27% speak English well, 6% speak English not well, 3% don't speak English at all).
In fiscal year 2004:
Federal Government expenditure: $714,294,000 ($3,254 per capita)
Department of Defense expenditure: $38,401,000
Federal direct payments to individuals for retirement and disability: $417,773,000
Federal other direct payments to individuals: $189,560,000
Federal direct payments not to individuals: $784,000
Federal grants: $64,008,000
Federal procurement contracts: $20,635,000 ($3,826,000 Department of Defense)
Federal salaries and wages: $21,533,000 ($111,000 Department of Defense)
Federal Government direct loans: $10,025,000
Federal guaranteed/insured loans: $190,426,000
Federal Government insurance: $923,207,000
Population change from April 1, 2000 to July 1, 2005:
Births: 15,569| Here: | 67 per 1000 residents |
| State: | 63 per 1000 residents |
Deaths: 7,277
| Here: | 31 per 1000 residents |
| State: | 49 per 1000 residents |
Net international migration: +8,162
| Here: | +35 per 1000 residents |
| State: | +30 per 1000 residents |
Net internal migration: +40,064
| Here: | +173 per 1000 residents |
| State: | +59 per 1000 residents |
Total withdrawal of fresh water for public supply: 30.00 millions of gallons per day (all from ground)
| Here: | 6.3 |
| State: | 5.9 |
| Here: | 4.8 |
| State: | 4.2 |
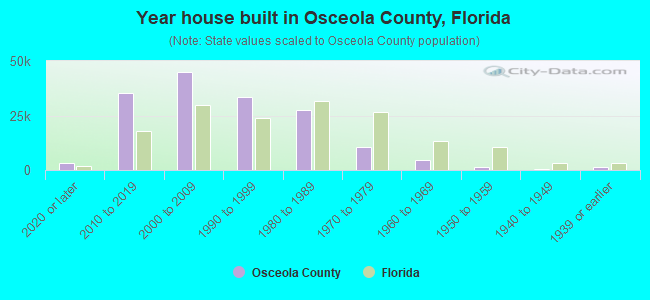
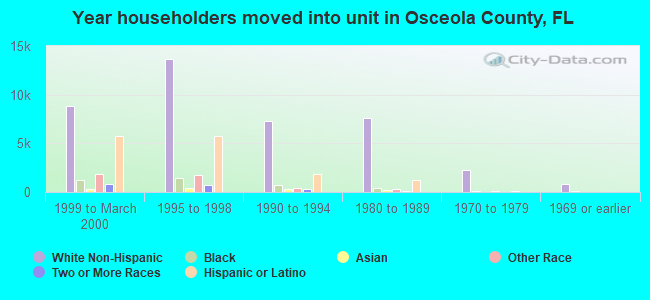
- Year house built in Osceola County, Florida
- 9,8582020 or later
- 38,4812010 to 2019
- 46,6312000 to 2009
- 32,4941990 to 1999
- 27,3131980 to 1989
- 8,1471970 to 1979
- 3,9761960 to 1969
- 3,0251950 to 1959
- 4921940 to 1949
- 1,7571939 or earlier
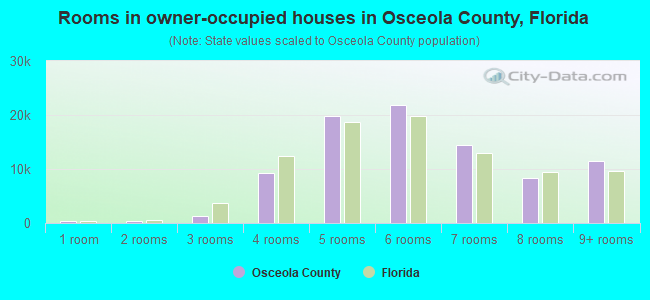
- Rooms in owner-occupied houses in Osceola County, Florida
- 3361 room
- 8312 rooms
- 1,9443 rooms
- 8,2884 rooms
- 16,4625 rooms
- 24,3836 rooms
- 19,1217 rooms
- 11,6498 rooms
- 11,7579+ rooms
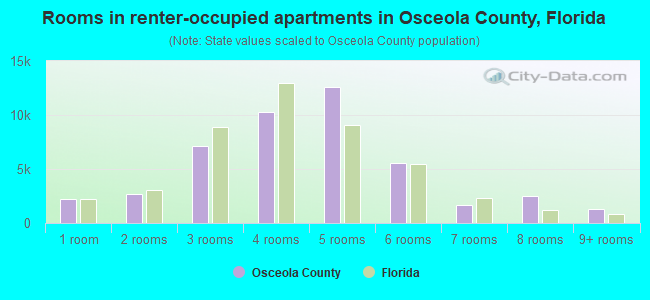
- Rooms in renter-occupied apartments in Osceola County, Florida
- 2,5151 room
- 3,5362 rooms
- 8,5973 rooms
- 10,5094 rooms
- 11,2095 rooms
- 11,2326 rooms
- 5,8747 rooms
- 1,3478 rooms
- 2,0289+ rooms
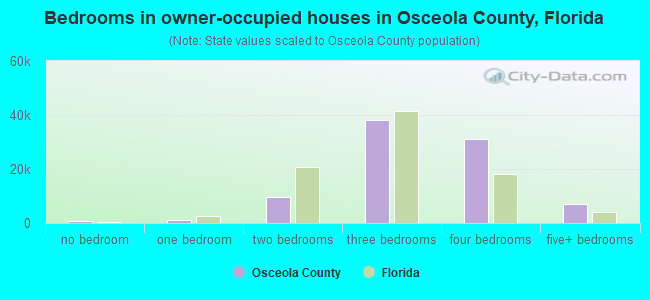
- Bedrooms in owner-occupied houses in Osceola County, Florida
- 472no bedroom
- 1,7251 bedroom
- 8,1412 bedrooms
- 43,5663 bedrooms
- 33,7554 bedrooms
- 7,1125+ bedrooms
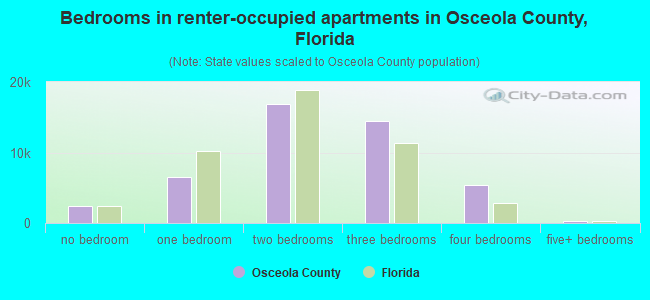
- Bedrooms in renter-occupied apartments in Osceola County, Florida
- 2,600no bedroom
- 8,0251 bedroom
- 17,7182 bedrooms
- 15,8463 bedrooms
- 11,0744 bedrooms
- 1,5845+ bedrooms
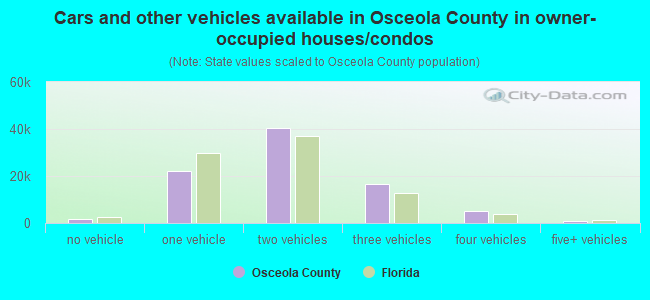
- Cars and other vehicles available in Osceola County in owner-occupied houses/condos
- 1,931no vehicle
- 24,6891 vehicle
- 41,9742 vehicles
- 18,6853 vehicles
- 6,1784 vehicles
- 1,3145+ vehicles
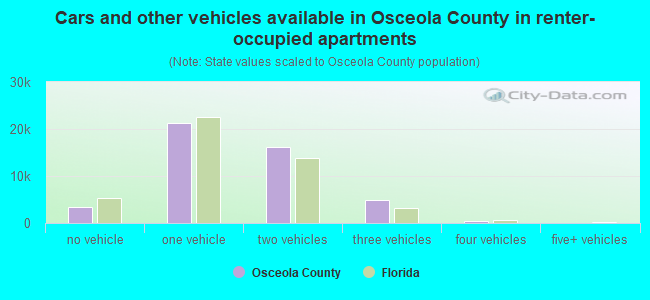
- Cars and other vehicles available in Osceola County in renter-occupied apartments
- 4,681no vehicle
- 23,1031 vehicle
- 19,6982 vehicles
- 7,1363 vehicles
- 2,2294 vehicles
- 05+ vehicles
85.6% of Osceola County residents lived in the same house 1 years ago.
Out of people who lived in different houses, 22% lived in this county.
Out of people who lived in different counties, 55% lived in Florida.
| Osceola County: | 85.6% |
| State average: | 86.3% |
Place of birth for U.S.-born residents:
- This state: 103,403
- Other state: 148,135
- Northeast: 83,186
- Midwest: 30,881
- South: 24,354
- West: 9,714
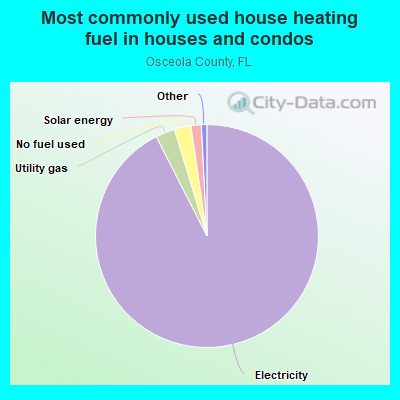
- 90.5%Electricity
- 3.4%Utility gas
- 3.4%Solar energy
- 1.6%No fuel used
- 0.6%Bottled, tank, or LP gas
- 0.2%Fuel oil, kerosene, etc.
- 0.2%Wood
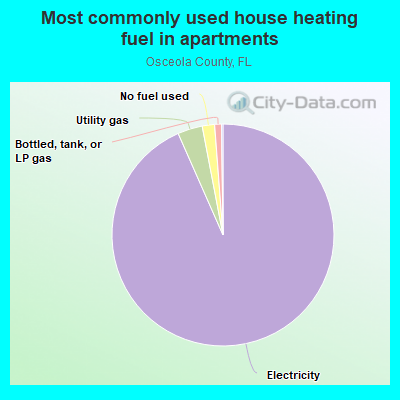
- 93.6%Electricity
- 4.1%Utility gas
- 1.7%No fuel used
- 0.4%Bottled, tank, or LP gas
- 0.1%Other fuel
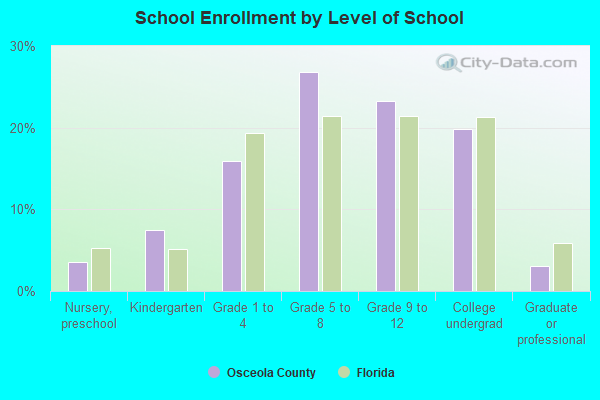
Private vs. public school enrollment:
| Here: | 15.5% |
| Florida: | 15.8% |
| Here: | 6.3% |
| Florida: | 12.9% |
| Here: | 16.1% |
| Florida: | 23.6% |
Osceola County government finances - Expenditure in 2020:
- Assistance and Subsidies - Public Welfare, Federal Categorical Assistance Programs: $15,348,000
Public Welfare, Federal Categorical Assistance Programs: $13,104,000
- Charges - Other: $28,485,000
Other: $23,313,000
Toll Highways: $16,085,000
Toll Highways: $15,251,000
Solid Waste Management: $4,353,000
Solid Waste Management: $4,088,000
Parks and Recreation: $2,808,000
Parks and Recreation: $2,158,000
Regular Highways: $140,000
Regular Highways: $88,000
Housing and Community Development: $64,000
Housing and Community Development: $52,000
- Construction - Regular Highways: $20,359,000
Regular Highways: $15,537,000
General - Other: $1,532,000
Elementary and Secondary Education: $389,000
General - Other: $49,000
- Current Operations - Police Protection: $94,421,000
Police Protection: $86,427,000
Regular Highways: $81,720,000
Local Fire Protection: $66,506,000
Financial Administration: $61,382,000
Local Fire Protection: $54,563,000
Regular Highways: $54,121,000
Financial Administration: $52,401,000
Correctional Institutions: $43,515,000
General - Other: $42,137,000
General - Other: $40,762,000
Correctional Institutions: $40,013,000
Parks and Recreation: $20,573,000
Judicial and Legal Services: $18,996,000
Solid Waste Management: $18,873,000
Housing and Community Development: $18,340,000
Solid Waste Management: $16,818,000
Judicial and Legal Services: $16,698,000
Housing and Community Development: $15,800,000
Central Staff Services: $11,196,000
Public Welfare - Other: $9,714,000
Central Staff Services: $9,475,000
Protective Inspection and Regulation - Other: $7,005,000
Libraries: $6,491,000
Health - Other: $4,460,000
Protective Inspection and Regulation - Other: $4,353,000
Health - Other: $3,970,000
Natural Resources - Other: $3,741,000
General Public Buildings: $3,664,000
General Public Buildings: $3,651,000
Natural Resources - Other: $3,092,000
Parks and Recreation: $2,109,000
Corrections - Other: $1,004,000
Corrections - Other: $959,000
Public Welfare - Other: $925,000
Elementary and Secondary Education: $83,000
Elementary and Secondary Education: $68,000
Libraries: $52,000
- Federal Intergovernmental - Other: $17,000,000
Highways: $15,364,000
Other: $14,459,000
Highways: $6,182,000
Public Welfare: $2,911,000
Public Welfare: $2,804,000
General Local Government Support: $2,065,000
General Local Government Support: $2,055,000
Housing and Community Development: $1,949,000
Housing and Community Development: $1,571,000
- General - Interest on Debt: $24,618,000
Interest on Debt: $22,654,000
- Intergovernmental to Local - Other - Transit Utilities: $9,289,000
Other - Transit Utilities: $7,255,000
- Local Intergovernmental - General Local Government Support: $10,692,000
General Local Government Support: $3,050,000
Other: $1,314,000
Education: $1,042,000
Education: $372,000
Other: $44,000
- Long Term Debt - Beginning Outstanding - Unspecified Public Purpose: $636,459,000
Outstanding Unspecified Public Purpose: $612,323,000
Outstanding Unspecified Public Purpose: $606,930,000
Beginning Outstanding - Unspecified Public Purpose: $605,770,000
Retired Unspecified Public Purpose: $74,670,000
Issue, Unspecified Public Purpose: $45,141,000
Beginning Outstanding - Public Debt for Private Purpose: $15,675,000
Outstanding Nonguaranteed - Industrial Revenue: $14,838,000
Beginning Outstanding - Public Debt for Private Purpose: $12,150,000
Issue, Unspecified Public Purpose: $11,595,000
Outstanding Nonguaranteed - Industrial Revenue: $11,145,000
Retired Unspecified Public Purpose: $5,042,000
Retired Nonguaranteed - Public Debt for Private Purpose: $1,005,000
Retired Nonguaranteed - Public Debt for Private Purpose: $837,000
- Miscellaneous - Special Assessments: $102,917,000
Special Assessments: $64,605,000
Interest Earnings: $14,748,000
General Revenue - Other: $7,516,000
Interest Earnings: $4,758,000
Fines and Forfeits: $3,190,000
General Revenue - Other: $3,136,000
Fines and Forfeits: $2,266,000
Rents: $1,219,000
Rents: $1,015,000
Donations From Private Sources: $718,000
Donations From Private Sources: $399,000
Sale of Property: $370,000
Sale of Property: $57,000
- Other Capital Outlay - Parks and Recreation: $14,897,000
Police Protection: $4,444,000
Police Protection: $3,915,000
General - Other: $1,064,000
Public Welfare - Other: $864,000
Correctional Institutions: $804,000
Correctional Institutions: $776,000
Financial Administration: $404,000
Natural Resources - Other: $252,000
Judicial and Legal Services: $206,000
Financial Administration: $201,000
Central Staff Services: $178,000
Judicial and Legal Services: $154,000
General Public Building: $132,000
Health - Other: $119,000
Parks and Recreation: $112,000
General Public Building: $66,000
Central Staff Services: $63,000
Elementary and Secondary Education: $57,000
Health - Other: $29,000
Local Fire Protection: $16,000
Corrections - Other: $1,000
- Other Funds - Cash and Securities: $591,559,000
Cash and Securities: $503,026,000
- Sinking Funds - Cash and Securities: $15,368,000
Cash and Securities: $11,633,000
- State Intergovernmental - General Local Government Support: $32,642,000
General Local Government Support: $28,524,000
Other: $16,514,000
Highways: $12,818,000
Other: $12,348,000
Highways: $6,221,000
Housing and Community Development: $1,590,000
Education: $925,000
Education: $707,000
Health and Hospitals: $447,000
Health and Hospitals: $447,000
Housing and Community Development: $437,000
Public Welfare: $420,000
Public Welfare: $209,000
- Tax - Property: $198,663,000
Property: $163,523,000
Other Selective Sales: $61,098,000
Other Selective Sales: $51,643,000
General Sales and Gross Receipts: $34,893,000
General Sales and Gross Receipts: $30,449,000
Public Utilities Sales: $21,744,000
Public Utilities Sales: $20,014,000
Other License: $17,755,000
Motor Fuels Sales: $17,576,000
Motor Fuels Sales: $16,652,000
Other License: $14,766,000
Occupation and Business License - Other: $3,211,000
Documentary and Stock Transfer: $3,138,000
Occupation and Business License - Other: $2,610,000
Documentary and Stock Transfer: $2,367,000
Osceola County government finances - Revenue in 2020:
- Assistance and Subsidies - Public Welfare, Federal Categorical Assistance Programs: $15,348,000
Public Welfare, Federal Categorical Assistance Programs: $13,104,000
- Charges - Other: $28,485,000
Other: $23,313,000
Toll Highways: $16,085,000
Toll Highways: $15,251,000
Solid Waste Management: $4,353,000
Solid Waste Management: $4,088,000
Parks and Recreation: $2,808,000
Parks and Recreation: $2,158,000
Regular Highways: $140,000
Regular Highways: $88,000
Housing and Community Development: $64,000
Housing and Community Development: $52,000
- Construction - Regular Highways: $20,359,000
Regular Highways: $15,537,000
General - Other: $1,532,000
Elementary and Secondary Education: $389,000
General - Other: $49,000
- Current Operations - Police Protection: $94,421,000
Police Protection: $86,427,000
Regular Highways: $81,720,000
Local Fire Protection: $66,506,000
Financial Administration: $61,382,000
Local Fire Protection: $54,563,000
Regular Highways: $54,121,000
Financial Administration: $52,401,000
Correctional Institutions: $43,515,000
General - Other: $42,137,000
General - Other: $40,762,000
Correctional Institutions: $40,013,000
Parks and Recreation: $20,573,000
Judicial and Legal Services: $18,996,000
Solid Waste Management: $18,873,000
Housing and Community Development: $18,340,000
Solid Waste Management: $16,818,000
Judicial and Legal Services: $16,698,000
Housing and Community Development: $15,800,000
Central Staff Services: $11,196,000
Public Welfare - Other: $9,714,000
Central Staff Services: $9,475,000
Protective Inspection and Regulation - Other: $7,005,000
Libraries: $6,491,000
Health - Other: $4,460,000
Protective Inspection and Regulation - Other: $4,353,000
Health - Other: $3,970,000
Natural Resources - Other: $3,741,000
General Public Buildings: $3,664,000
General Public Buildings: $3,651,000
Natural Resources - Other: $3,092,000
Parks and Recreation: $2,109,000
Corrections - Other: $1,004,000
Corrections - Other: $959,000
Public Welfare - Other: $925,000
Elementary and Secondary Education: $83,000
Elementary and Secondary Education: $68,000
Libraries: $52,000
- Federal Intergovernmental - Other: $17,000,000
Highways: $15,364,000
Other: $14,459,000
Highways: $6,182,000
Public Welfare: $2,911,000
Public Welfare: $2,804,000
General Local Government Support: $2,065,000
General Local Government Support: $2,055,000
Housing and Community Development: $1,949,000
Housing and Community Development: $1,571,000
- General - Interest on Debt: $24,618,000
Interest on Debt: $22,654,000
- Intergovernmental to Local - Other - Transit Utilities: $9,289,000
Other - Transit Utilities: $7,255,000
- Local Intergovernmental - General Local Government Support: $10,692,000
General Local Government Support: $3,050,000
Other: $1,314,000
Education: $1,042,000
Education: $372,000
Other: $44,000
- Long Term Debt - Beginning Outstanding - Unspecified Public Purpose: $636,459,000
Outstanding Unspecified Public Purpose: $612,323,000
Outstanding Unspecified Public Purpose: $606,930,000
Beginning Outstanding - Unspecified Public Purpose: $605,770,000
Retired Unspecified Public Purpose: $74,670,000
Issue, Unspecified Public Purpose: $45,141,000
Beginning Outstanding - Public Debt for Private Purpose: $15,675,000
Outstanding Nonguaranteed - Industrial Revenue: $14,838,000
Beginning Outstanding - Public Debt for Private Purpose: $12,150,000
Issue, Unspecified Public Purpose: $11,595,000
Outstanding Nonguaranteed - Industrial Revenue: $11,145,000
Retired Unspecified Public Purpose: $5,042,000
Retired Nonguaranteed - Public Debt for Private Purpose: $1,005,000
Retired Nonguaranteed - Public Debt for Private Purpose: $837,000
- Miscellaneous - Special Assessments: $102,917,000
Special Assessments: $64,605,000
Interest Earnings: $14,748,000
General Revenue - Other: $7,516,000
Interest Earnings: $4,758,000
Fines and Forfeits: $3,190,000
General Revenue - Other: $3,136,000
Fines and Forfeits: $2,266,000
Rents: $1,219,000
Rents: $1,015,000
Donations From Private Sources: $718,000
Donations From Private Sources: $399,000
Sale of Property: $370,000
Sale of Property: $57,000
- Other Capital Outlay - Parks and Recreation: $14,897,000
Police Protection: $4,444,000
Police Protection: $3,915,000
General - Other: $1,064,000
Public Welfare - Other: $864,000
Correctional Institutions: $804,000
Correctional Institutions: $776,000
Financial Administration: $404,000
Natural Resources - Other: $252,000
Judicial and Legal Services: $206,000
Financial Administration: $201,000
Central Staff Services: $178,000
Judicial and Legal Services: $154,000
General Public Building: $132,000
Health - Other: $119,000
Parks and Recreation: $112,000
General Public Building: $66,000
Central Staff Services: $63,000
Elementary and Secondary Education: $57,000
Health - Other: $29,000
Local Fire Protection: $16,000
Corrections - Other: $1,000
- Other Funds - Cash and Securities: $591,559,000
Cash and Securities: $503,026,000
- Sinking Funds - Cash and Securities: $15,368,000
Cash and Securities: $11,633,000
- State Intergovernmental - General Local Government Support: $32,642,000
General Local Government Support: $28,524,000
Other: $16,514,000
Highways: $12,818,000
Other: $12,348,000
Highways: $6,221,000
Housing and Community Development: $1,590,000
Education: $925,000
Education: $707,000
Health and Hospitals: $447,000
Health and Hospitals: $447,000
Housing and Community Development: $437,000
Public Welfare: $420,000
Public Welfare: $209,000
- Tax - Property: $198,663,000
Property: $163,523,000
Other Selective Sales: $61,098,000
Other Selective Sales: $51,643,000
General Sales and Gross Receipts: $34,893,000
General Sales and Gross Receipts: $30,449,000
Public Utilities Sales: $21,744,000
Public Utilities Sales: $20,014,000
Other License: $17,755,000
Motor Fuels Sales: $17,576,000
Motor Fuels Sales: $16,652,000
Other License: $14,766,000
Occupation and Business License - Other: $3,211,000
Documentary and Stock Transfer: $3,138,000
Occupation and Business License - Other: $2,610,000
Documentary and Stock Transfer: $2,367,000
Osceola County government finances - Debt in 2020:
- Assistance and Subsidies - Public Welfare, Federal Categorical Assistance Programs: $15,348,000
Public Welfare, Federal Categorical Assistance Programs: $13,104,000
- Charges - Other: $28,485,000
Other: $23,313,000
Toll Highways: $16,085,000
Toll Highways: $15,251,000
Solid Waste Management: $4,353,000
Solid Waste Management: $4,088,000
Parks and Recreation: $2,808,000
Parks and Recreation: $2,158,000
Regular Highways: $140,000
Regular Highways: $88,000
Housing and Community Development: $64,000
Housing and Community Development: $52,000
- Construction - Regular Highways: $20,359,000
Regular Highways: $15,537,000
General - Other: $1,532,000
Elementary and Secondary Education: $389,000
General - Other: $49,000
- Current Operations - Police Protection: $94,421,000
Police Protection: $86,427,000
Regular Highways: $81,720,000
Local Fire Protection: $66,506,000
Financial Administration: $61,382,000
Local Fire Protection: $54,563,000
Regular Highways: $54,121,000
Financial Administration: $52,401,000
Correctional Institutions: $43,515,000
General - Other: $42,137,000
General - Other: $40,762,000
Correctional Institutions: $40,013,000
Parks and Recreation: $20,573,000
Judicial and Legal Services: $18,996,000
Solid Waste Management: $18,873,000
Housing and Community Development: $18,340,000
Solid Waste Management: $16,818,000
Judicial and Legal Services: $16,698,000
Housing and Community Development: $15,800,000
Central Staff Services: $11,196,000
Public Welfare - Other: $9,714,000
Central Staff Services: $9,475,000
Protective Inspection and Regulation - Other: $7,005,000
Libraries: $6,491,000
Health - Other: $4,460,000
Protective Inspection and Regulation - Other: $4,353,000
Health - Other: $3,970,000
Natural Resources - Other: $3,741,000
General Public Buildings: $3,664,000
General Public Buildings: $3,651,000
Natural Resources - Other: $3,092,000
Parks and Recreation: $2,109,000
Corrections - Other: $1,004,000
Corrections - Other: $959,000
Public Welfare - Other: $925,000
Elementary and Secondary Education: $83,000
Elementary and Secondary Education: $68,000
Libraries: $52,000
- Federal Intergovernmental - Other: $17,000,000
Highways: $15,364,000
Other: $14,459,000
Highways: $6,182,000
Public Welfare: $2,911,000
Public Welfare: $2,804,000
General Local Government Support: $2,065,000
General Local Government Support: $2,055,000
Housing and Community Development: $1,949,000
Housing and Community Development: $1,571,000
- General - Interest on Debt: $24,618,000
Interest on Debt: $22,654,000
- Intergovernmental to Local - Other - Transit Utilities: $9,289,000
Other - Transit Utilities: $7,255,000
- Local Intergovernmental - General Local Government Support: $10,692,000
General Local Government Support: $3,050,000
Other: $1,314,000
Education: $1,042,000
Education: $372,000
Other: $44,000
- Long Term Debt - Beginning Outstanding - Unspecified Public Purpose: $636,459,000
Outstanding Unspecified Public Purpose: $612,323,000
Outstanding Unspecified Public Purpose: $606,930,000
Beginning Outstanding - Unspecified Public Purpose: $605,770,000
Retired Unspecified Public Purpose: $74,670,000
Issue, Unspecified Public Purpose: $45,141,000
Beginning Outstanding - Public Debt for Private Purpose: $15,675,000
Outstanding Nonguaranteed - Industrial Revenue: $14,838,000
Beginning Outstanding - Public Debt for Private Purpose: $12,150,000
Issue, Unspecified Public Purpose: $11,595,000
Outstanding Nonguaranteed - Industrial Revenue: $11,145,000
Retired Unspecified Public Purpose: $5,042,000
Retired Nonguaranteed - Public Debt for Private Purpose: $1,005,000
Retired Nonguaranteed - Public Debt for Private Purpose: $837,000
- Miscellaneous - Special Assessments: $102,917,000
Special Assessments: $64,605,000
Interest Earnings: $14,748,000
General Revenue - Other: $7,516,000
Interest Earnings: $4,758,000
Fines and Forfeits: $3,190,000
General Revenue - Other: $3,136,000
Fines and Forfeits: $2,266,000
Rents: $1,219,000
Rents: $1,015,000
Donations From Private Sources: $718,000
Donations From Private Sources: $399,000
Sale of Property: $370,000
Sale of Property: $57,000
- Other Capital Outlay - Parks and Recreation: $14,897,000
Police Protection: $4,444,000
Police Protection: $3,915,000
General - Other: $1,064,000
Public Welfare - Other: $864,000
Correctional Institutions: $804,000
Correctional Institutions: $776,000
Financial Administration: $404,000
Natural Resources - Other: $252,000
Judicial and Legal Services: $206,000
Financial Administration: $201,000
Central Staff Services: $178,000
Judicial and Legal Services: $154,000
General Public Building: $132,000
Health - Other: $119,000
Parks and Recreation: $112,000
General Public Building: $66,000
Central Staff Services: $63,000
Elementary and Secondary Education: $57,000
Health - Other: $29,000
Local Fire Protection: $16,000
Corrections - Other: $1,000
- Other Funds - Cash and Securities: $591,559,000
Cash and Securities: $503,026,000
- Sinking Funds - Cash and Securities: $15,368,000
Cash and Securities: $11,633,000
- State Intergovernmental - General Local Government Support: $32,642,000
General Local Government Support: $28,524,000
Other: $16,514,000
Highways: $12,818,000
Other: $12,348,000
Highways: $6,221,000
Housing and Community Development: $1,590,000
Education: $925,000
Education: $707,000
Health and Hospitals: $447,000
Health and Hospitals: $447,000
Housing and Community Development: $437,000
Public Welfare: $420,000
Public Welfare: $209,000
- Tax - Property: $198,663,000
Property: $163,523,000
Other Selective Sales: $61,098,000
Other Selective Sales: $51,643,000
General Sales and Gross Receipts: $34,893,000
General Sales and Gross Receipts: $30,449,000
Public Utilities Sales: $21,744,000
Public Utilities Sales: $20,014,000
Other License: $17,755,000
Motor Fuels Sales: $17,576,000
Motor Fuels Sales: $16,652,000
Other License: $14,766,000
Occupation and Business License - Other: $3,211,000
Documentary and Stock Transfer: $3,138,000
Occupation and Business License - Other: $2,610,000
Documentary and Stock Transfer: $2,367,000
Osceola County government finances - Cash and Securities in 2020:
- Assistance and Subsidies - Public Welfare, Federal Categorical Assistance Programs: $15,348,000
Public Welfare, Federal Categorical Assistance Programs: $13,104,000
- Charges - Other: $28,485,000
Other: $23,313,000
Toll Highways: $16,085,000
Toll Highways: $15,251,000
Solid Waste Management: $4,353,000
Solid Waste Management: $4,088,000
Parks and Recreation: $2,808,000
Parks and Recreation: $2,158,000
Regular Highways: $140,000
Regular Highways: $88,000
Housing and Community Development: $64,000
Housing and Community Development: $52,000
- Construction - Regular Highways: $20,359,000
Regular Highways: $15,537,000
General - Other: $1,532,000
Elementary and Secondary Education: $389,000
General - Other: $49,000
- Current Operations - Police Protection: $94,421,000
Police Protection: $86,427,000
Regular Highways: $81,720,000
Local Fire Protection: $66,506,000
Financial Administration: $61,382,000
Local Fire Protection: $54,563,000
Regular Highways: $54,121,000
Financial Administration: $52,401,000
Correctional Institutions: $43,515,000
General - Other: $42,137,000
General - Other: $40,762,000
Correctional Institutions: $40,013,000
Parks and Recreation: $20,573,000
Judicial and Legal Services: $18,996,000
Solid Waste Management: $18,873,000
Housing and Community Development: $18,340,000
Solid Waste Management: $16,818,000
Judicial and Legal Services: $16,698,000
Housing and Community Development: $15,800,000
Central Staff Services: $11,196,000
Public Welfare - Other: $9,714,000
Central Staff Services: $9,475,000
Protective Inspection and Regulation - Other: $7,005,000
Libraries: $6,491,000
Health - Other: $4,460,000
Protective Inspection and Regulation - Other: $4,353,000
Health - Other: $3,970,000
Natural Resources - Other: $3,741,000
General Public Buildings: $3,664,000
General Public Buildings: $3,651,000
Natural Resources - Other: $3,092,000
Parks and Recreation: $2,109,000
Corrections - Other: $1,004,000
Corrections - Other: $959,000
Public Welfare - Other: $925,000
Elementary and Secondary Education: $83,000
Elementary and Secondary Education: $68,000
Libraries: $52,000
- Federal Intergovernmental - Other: $17,000,000
Highways: $15,364,000
Other: $14,459,000
Highways: $6,182,000
Public Welfare: $2,911,000
Public Welfare: $2,804,000
General Local Government Support: $2,065,000
General Local Government Support: $2,055,000
Housing and Community Development: $1,949,000
Housing and Community Development: $1,571,000
- General - Interest on Debt: $24,618,000
Interest on Debt: $22,654,000
- Intergovernmental to Local - Other - Transit Utilities: $9,289,000
Other - Transit Utilities: $7,255,000
- Local Intergovernmental - General Local Government Support: $10,692,000
General Local Government Support: $3,050,000
Other: $1,314,000
Education: $1,042,000
Education: $372,000
Other: $44,000
- Long Term Debt - Beginning Outstanding - Unspecified Public Purpose: $636,459,000
Outstanding Unspecified Public Purpose: $612,323,000
Outstanding Unspecified Public Purpose: $606,930,000
Beginning Outstanding - Unspecified Public Purpose: $605,770,000
Retired Unspecified Public Purpose: $74,670,000
Issue, Unspecified Public Purpose: $45,141,000
Beginning Outstanding - Public Debt for Private Purpose: $15,675,000
Outstanding Nonguaranteed - Industrial Revenue: $14,838,000
Beginning Outstanding - Public Debt for Private Purpose: $12,150,000
Issue, Unspecified Public Purpose: $11,595,000
Outstanding Nonguaranteed - Industrial Revenue: $11,145,000
Retired Unspecified Public Purpose: $5,042,000
Retired Nonguaranteed - Public Debt for Private Purpose: $1,005,000
Retired Nonguaranteed - Public Debt for Private Purpose: $837,000
- Miscellaneous - Special Assessments: $102,917,000
Special Assessments: $64,605,000
Interest Earnings: $14,748,000
General Revenue - Other: $7,516,000
Interest Earnings: $4,758,000
Fines and Forfeits: $3,190,000
General Revenue - Other: $3,136,000
Fines and Forfeits: $2,266,000
Rents: $1,219,000
Rents: $1,015,000
Donations From Private Sources: $718,000
Donations From Private Sources: $399,000
Sale of Property: $370,000
Sale of Property: $57,000
- Other Capital Outlay - Parks and Recreation: $14,897,000
Police Protection: $4,444,000
Police Protection: $3,915,000
General - Other: $1,064,000
Public Welfare - Other: $864,000
Correctional Institutions: $804,000
Correctional Institutions: $776,000
Financial Administration: $404,000
Natural Resources - Other: $252,000
Judicial and Legal Services: $206,000
Financial Administration: $201,000
Central Staff Services: $178,000
Judicial and Legal Services: $154,000
General Public Building: $132,000
Health - Other: $119,000
Parks and Recreation: $112,000
General Public Building: $66,000
Central Staff Services: $63,000
Elementary and Secondary Education: $57,000
Health - Other: $29,000
Local Fire Protection: $16,000
Corrections - Other: $1,000
- Other Funds - Cash and Securities: $591,559,000
Cash and Securities: $503,026,000
- Sinking Funds - Cash and Securities: $15,368,000
Cash and Securities: $11,633,000
- State Intergovernmental - General Local Government Support: $32,642,000
General Local Government Support: $28,524,000
Other: $16,514,000
Highways: $12,818,000
Other: $12,348,000
Highways: $6,221,000
Housing and Community Development: $1,590,000
Education: $925,000
Education: $707,000
Health and Hospitals: $447,000
Health and Hospitals: $447,000
Housing and Community Development: $437,000
Public Welfare: $420,000
Public Welfare: $209,000
- Tax - Property: $198,663,000
Property: $163,523,000
Other Selective Sales: $61,098,000
Other Selective Sales: $51,643,000
General Sales and Gross Receipts: $34,893,000
General Sales and Gross Receipts: $30,449,000
Public Utilities Sales: $21,744,000
Public Utilities Sales: $20,014,000
Other License: $17,755,000
Motor Fuels Sales: $17,576,000
Motor Fuels Sales: $16,652,000
Other License: $14,766,000
Occupation and Business License - Other: $3,211,000
Documentary and Stock Transfer: $3,138,000
Occupation and Business License - Other: $2,610,000
Documentary and Stock Transfer: $2,367,000
Supplemental Security Income (SSI) in 2006:
- Total number of recipients: 6,313
- Number of aged recipients: 942
- Number of blind and disabled recipients: 5,371
- Number of recipients under 18: 1,717
- Number of recipients between 18 and 64: 3,050
- Number of recipients older than 64: 1,546
- Number of recipients also receiving OASDI: 1,865
- Amount of payments (thousands of dollars): 2,806
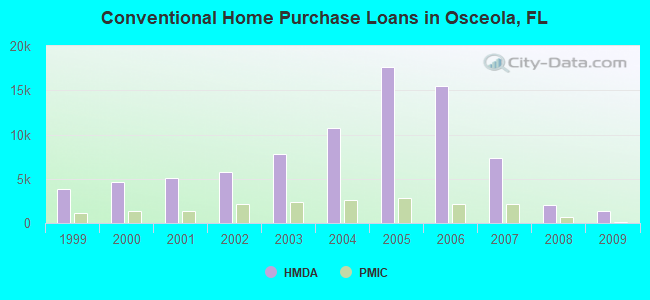
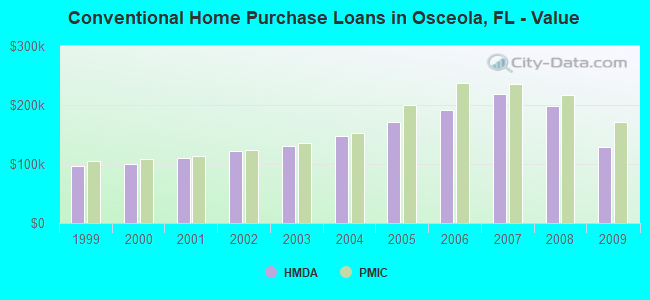
| Home Mortgage Disclosure Act Aggregated Statistics For Year 2009 (Based on 28 full tracts) | ||||||||||||
| A) FHA, FSA/RHS & VA Home Purchase Loans | B) Conventional Home Purchase Loans | C) Refinancings | D) Home Improvement Loans | F) Non-occupant Loans on < 5 Family Dwellings (A B C & D) | G) Loans On Manufactured Home Dwelling (A B C & D) | |||||||
|---|---|---|---|---|---|---|---|---|---|---|---|---|
| Number | Average Value | Number | Average Value | Number | Average Value | Number | Average Value | Number | Average Value | Number | Average Value | |
| LOANS ORIGINATED | 1,741 | $132,605 | 1,316 | $129,647 | 1,356 | $165,075 | 48 | $72,021 | 905 | $138,908 | 81 | $78,716 |
| APPLICATIONS APPROVED, NOT ACCEPTED | 85 | $124,506 | 115 | $146,217 | 238 | $168,193 | 14 | $54,714 | 99 | $142,727 | 26 | $74,077 |
| APPLICATIONS DENIED | 633 | $135,272 | 623 | $128,563 | 1,715 | $172,478 | 133 | $53,391 | 617 | $143,817 | 131 | $79,870 |
| APPLICATIONS WITHDRAWN | 320 | $135,612 | 275 | $123,738 | 630 | $168,844 | 25 | $95,120 | 207 | $142,097 | 18 | $143,500 |
| FILES CLOSED FOR INCOMPLETENESS | 113 | $125,398 | 87 | $149,954 | 280 | $164,779 | 14 | $111,071 | 75 | $166,653 | 12 | $106,500 |
| Private Mortgage Insurance Companies Aggregated Statistics For Year 2009 (Based on 25 full tracts) | ||||||||
| A) Conventional Home Purchase Loans | B) Refinancings | C) Non-occupant Loans on < 5 Family Dwellings (A & B) | D) Loans On Manufactured Home Dwelling (A & B) | |||||
|---|---|---|---|---|---|---|---|---|
| Number | Average Value | Number | Average Value | Number | Average Value | Number | Average Value | |
| LOANS ORIGINATED | 64 | $170,797 | 16 | $165,812 | 8 | $196,750 | 1 | $170,000 |
| APPLICATIONS APPROVED, NOT ACCEPTED | 56 | $227,964 | 18 | $232,389 | 16 | $208,438 | 0 | $0 |
| APPLICATIONS DENIED | 20 | $138,800 | 13 | $161,462 | 6 | $103,667 | 0 | $0 |
| APPLICATIONS WITHDRAWN | 14 | $136,357 | 4 | $240,500 | 3 | $106,000 | 0 | $0 |
| FILES CLOSED FOR INCOMPLETENESS | 14 | $253,071 | 2 | $154,000 | 7 | $220,000 | 0 | $0 |
| Most common first names in Osceola County, FL among deceased individuals | ||
| Name | Count | Lived (average) |
|---|---|---|
| John | 370 | 74.7 years |
| Robert | 309 | 73.0 years |
| Mary | 299 | 79.6 years |
| James | 294 | 72.5 years |
| William | 289 | 76.0 years |
| Charles | 197 | 74.8 years |
| George | 178 | 76.6 years |
| Joseph | 177 | 75.6 years |
| Helen | 164 | 83.6 years |
| Richard | 161 | 70.8 years |
| Most common last names in Osceola County, FL among deceased individuals | ||
| Last name | Count | Lived (average) |
|---|---|---|
| Smith | 136 | 75.6 years |
| Rodriguez | 99 | 71.8 years |
| Brown | 90 | 76.3 years |
| Johnson | 86 | 77.4 years |
| Rivera | 86 | 69.4 years |
| Williams | 80 | 77.2 years |
| Miller | 62 | 77.3 years |
| Jones | 62 | 78.7 years |
| Gonzalez | 53 | 71.9 years |
| Anderson | 53 | 79.0 years |
| Businesses in Osceola County, FL | ||||
| Name | Count | Name | Count | |
|---|---|---|---|---|
| 7-Eleven | 19 | LensCrafters | 1 | |
| ALDI | 1 | Little Caesars Pizza | 5 | |
| AMF Bowling | 1 | Long John Silver's | 2 | |
| AT&T | 6 | Lowe's | 2 | |
| Ace Hardware | 1 | Marshalls | 1 | |
| Advance Auto Parts | 9 | MasterBrand Cabinets | 3 | |
| Aeropostale | 1 | McDonald's | 11 | |
| American Eagle Outfitters | 1 | Men's Wearhouse | 2 | |
| Applebee's | 2 | Motel 6 | 1 | |
| Arby's | 2 | New Balance | 1 | |
| Ashley Furniture | 2 | Nike | 7 | |
| AutoZone | 5 | OfficeMax | 1 | |
| Baskin-Robbins | 4 | Old Navy | 1 | |
| Baymont Inn | 1 | Olive Garden | 2 | |
| Bed Bath & Beyond | 1 | Outback | 2 | |
| Ben & Jerry's | 1 | Outback Steakhouse | 2 | |
| Blockbuster | 4 | Pac Sun | 1 | |
| Budget Car Rental | 2 | Panda Express | 2 | |
| Buffalo Wild Wings | 1 | Panera Bread | 1 | |
| Burger King | 9 | Papa John's Pizza | 2 | |
| CVS | 11 | Payless | 4 | |
| Chevrolet | 2 | Penske | 4 | |
| Chipotle | 1 | Pier 1 Imports | 1 | |
| Circle K | 1 | Pizza Hut | 9 | |
| Clarion | 1 | Popeyes | 3 | |
| ColorTyme | 2 | Publix Super Markets | 12 | |
| Comfort Suites | 1 | Quality | 2 | |
| Cracker Barrel | 1 | Quiznos | 2 | |
| Curves | 2 | RadioShack | 3 | |
| DHL | 3 | Ramada | 1 | |
| Dairy Queen | 2 | Red Lobster | 2 | |
| Days Inn | 1 | Red Roof Inn | 1 | |
| Dennys | 6 | Rodeway Inn | 1 | |
| Discount Tire | 1 | Rooms To Go | 2 | |
| Domino's Pizza | 5 | Ruby Tuesday | 1 | |
| DressBarn | 1 | Rue21 | 1 | |
| Dressbarn | 1 | SONIC Drive-In | 1 | |
| Dunkin Donuts | 11 | Sam's Club | 1 | |
| Econo Lodge | 2 | Sephora | 1 | |
| Famous Footwear | 1 | Sprint Nextel | 3 | |
| FedEx | 29 | Staples | 2 | |
| Foot Locker | 1 | Starbucks | 3 | |
| Ford | 2 | Steak 'n Shake | 1 | |
| GNC | 4 | Studio 6 | 1 | |
| GameStop | 7 | Subway | 16 | |
| Goodwill | 5 | Super 8 | 2 | |
| H&R Block | 9 | T-Mobile | 7 | |
| Haagen-Dazs | 1 | T.G.I. Driday's | 1 | |
| Hilton | 1 | T.J.Maxx | 1 | |
| Holiday Inn | 2 | Taco Bell | 9 | |
| Home Depot | 3 | Target | 2 | |
| Howard Johnson | 3 | Tire Kingdom | 5 | |
| IHOP | 5 | Toys"R"Us | 1 | |
| JCPenney | 1 | Travelodge | 2 | |
| Johnny Rockets | 1 | U-Haul | 25 | |
| Jones New York | 2 | UPS | 28 | |
| Journeys | 1 | Vans | 1 | |
| Justice | 1 | Verizon Wireless | 3 | |
| KFC | 9 | Village Inn | 1 | |
| Kmart | 1 | Waffle House | 3 | |
| Knights Inn | 1 | Walgreens | 7 | |
| Kohl's | 1 | Walmart | 5 | |
| La-Z-Boy | 1 | Wet Seal | 1 | |
| Lane Bryant | 1 | YMCA | 2 | |
| Lane Furniture | 1 | |||
Osceola County on our top lists:
- #18 on the list of "Top 101 counties with the highest percentage of residents that smoked 100+ cigarettes in their lives"
- #24 on the list of "Top 101 counties with the highest percentage of residents relocating from other counties between 2010 and 2011 (pop. 50,000+)"
- #27 on the list of "Top 101 counties with the largest decrease in the number of deaths per 1000 residents 2000-2006 to 2007-2013 (pop. 50,000+)"
- #32 on the list of "Top 101 counties with the highest percentage of residents relocating to other counties in 2011 (pop. 50,000+)"
- #44 on the list of "Top 101 counties with the lowest percentage of residents that exercised in the past month"
- #65 on the list of "Top 101 counties with the highest percentage of residents relocating from other counties between 2010 and 2011"
- #69 on the list of "Top 101 counties with the highest percentage of residents relocating from foreign countries between 2010 and 2011 (pop. 50,000+)"
- #73 on the list of "Top 101 counties with the highest percentage of residents relocating to foreign countries in 2011 (pop. 50,000+)"
- #76 on the list of "Top 101 counties with the worst general health status score of residents (1-5), 3 years of data"
- #80 on the list of "Top 101 counties with the highest ground withdrawal of fresh water for public supply (pop. 50,000+)"
- #81 on the list of "Top 101 counties with the highest ground withdrawal of fresh water for public supply"
- #88 on the list of "Top 101 counties with the highest percentage of residents relocating to other counties in 2011"
- #96 on the list of "Top 101 counties with the highest percentage of residents relocating from foreign countries between 2010 and 2011"