Duval County, Texas (TX)
County owner-occupied free and clear houses and condos in 2010: 2,313
County owner-occupied houses and condos in 2000: 3,515
Renter-occupied apartments: 918 (it was 835 in 2000)
| % of renters here: | 19% |
| State: | 36% |
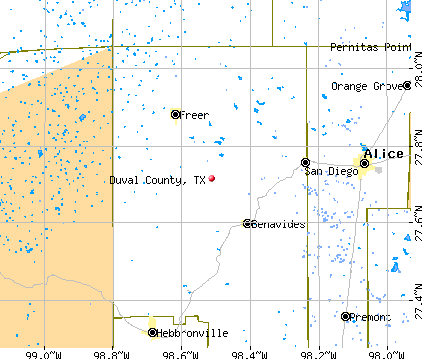
Land area: 1793 sq. mi.
Water area: 3.0 sq. mi.
Population density: 6 people per square mile (very low).
Industries providing employment: Educational, health and social services (28.6%), Agriculture,forestry,fishing and hunting, and mining (20.4%).
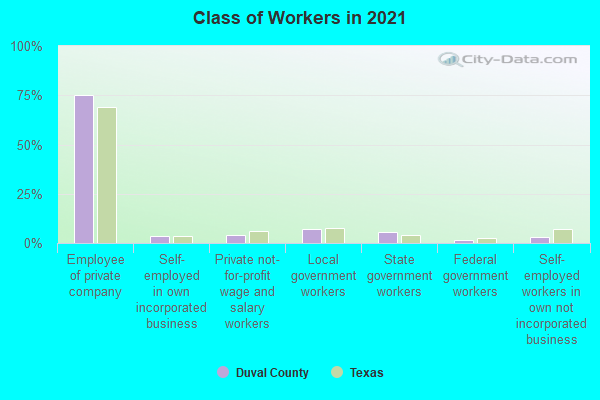
Type of workers:
- Private wage or salary: 84%
- Government: 14%
- Self-employed, not incorporated: 2%
- Unpaid family work: 0%
- OSM Map
- General Map
- Google Map
- MSN Map

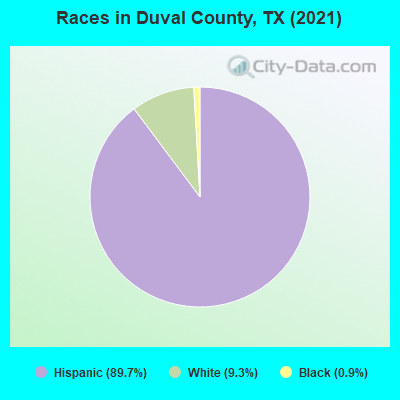
- 9,14088.9%Hispanic or Latino
- 9809.5%White Non-Hispanic Alone
- 860.8%Black Non-Hispanic Alone
- 710.7%Two or more races
| Median resident age: | 35.9 years |
| Texas median age: | 35.6 years |
| Males: 5,234 | |
| Females: 4,993 |

 | Abilene, Tx: Worst city in Texas hands down!! (62 replies) |
| Is laredo doing a great job at growing as a city? (17 replies) |
| New County Population Estimates from the Census Bureau for Jluy 1, 2016 posted this morning about 9 A. M. (13 replies) |
| Texas Trivia (1626 replies) |
| San Antonio/Austin Chargers (34 replies) |
| The Story Behind Manchaca Rd misspelling/pronunciation (19 replies) |
| Duval County: | 2.0 people |
| Texas: | 3 people |
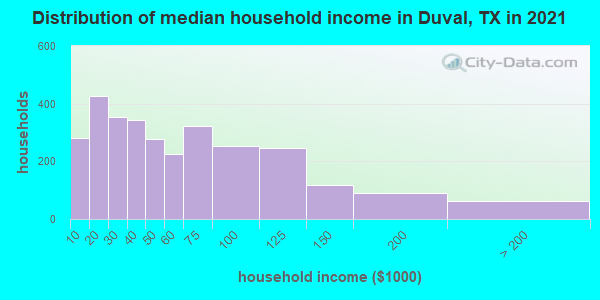
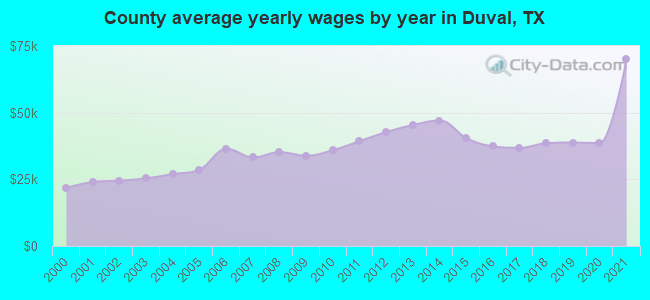
Estimated median household income in 2022: $50,175 ($22,416 in 1999)
| This county: | $50,175 |
| Texas: | $72,284 |
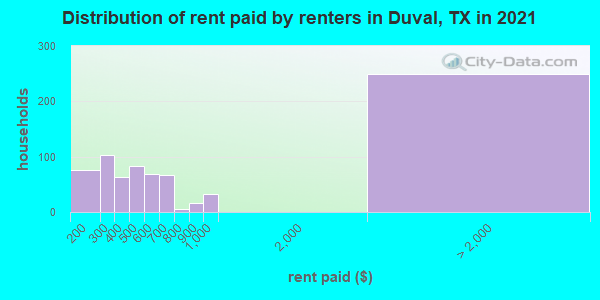
Median contract rent in 2022 for apartments: $625 (lower quartile is $305, upper quartile is $768)
| This county: | $625 |
| State: | $1117 |
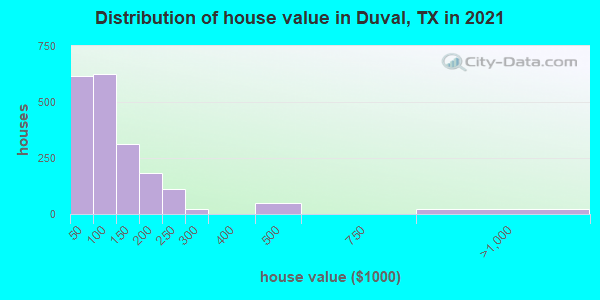
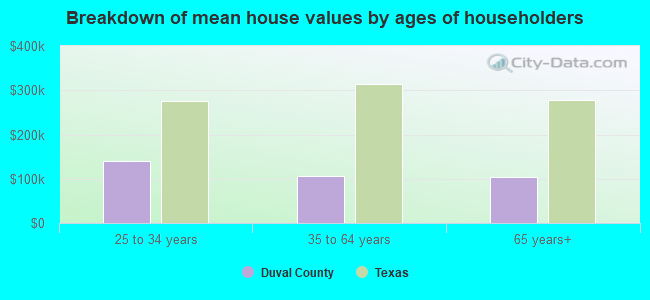
Estimated median house or condo value in 2022: $87,943 (it was $28,900 in 2000)
| Duval: | $87,943 |
| Texas: | $275,400 |
Median monthly housing costs for homes and condos with a mortgage: $1,153
Median monthly housing costs for units without a mortgage: $410
Institutionalized population: 576
Crime in 2021 (reported by the sheriff's office or county police, not the county total):
- Murders: 0
- Rapes: 2
- Robberies: 0
- Assaults: 11
- Burglaries: 21
- Thefts: 41
- Auto thefts: 34
Crime in 2020 (reported by the sheriff's office or county police, not the county total):
- Murders: 0
- Rapes: 2
- Robberies: 0
- Assaults: 16
- Burglaries: 10
- Thefts: 55
- Auto thefts: 34
Median real estate property taxes paid for housing units with mortgages in 2022: $1,483 (0.9%)
Median real estate property taxes paid for housing units with no mortgage in 2022: $602 (0.8%)
| Duval County: | 21.6% |
| Texas: | 14.0% |
Median age of residents in 2022: 35.9 years old
(Males: 36.0 years old, Females: 35.9 years old)
(Median age for: White residents: 40.1 years old, Black residents: 46.4 years old, American Indian residents: 24.4 years old, Hispanic or Latino residents: 35.6 years old, Other race residents: 31.0 years old)
Fair market rent in 2006 for a 1-bedroom apartment in Duval County is $420 a month.
Fair market rent for a 2-bedroom apartment is $484 a month.
Fair market rent for a 3-bedroom apartment is $645 a month.
Cities in this county include: San Diego, Freer, Rosita, Benavides, Realitos, Concepcion.
Notable locations in this county outside city limits:
Notable locations in Duval County: Alice Country Club (A), Agua Fria Windmill (B), Devisadero Windmill (C), Ebanito Windmill (D), Edwardo Windmill (E), Ella Windmill (F), Guajalote Windmill (G), Javalina Windmill (H), King Ranch Windmill (I), La Patrona Windmill (J), Ladder Windmill (K), Lamar Windmill (L), Llano Ancho Windmill (M), Los Jaboncillos Ranch (N), Moos Windmill (O), Nancy Windmill (P), Narciso Windmill (Q), New Well Windmill (R), New Windmill (S), Ochento Windmill (T). Display/hide their locations on the map
Church in Duval County: San Jose Church (A). Display/hide its location on the map
Cemeteries: Adams Cemetery (1), Amargosa Cemetery (2), Barrera Cemetery (3), Cadenas Cemetery (4), Calaveras Cemetery (5), Dilworth Cemetery (6), Old Ranch Cemetery (7). Display/hide their locations on the map
Lakes, reservoirs, and swamps: Big Lake (A), Trinidad Lake (B), Willie Tank (C), Salado Tank (D), Rye Tank (E), Rosita Tank (F), Romera Tank (G), Olmo Lake (H). Display/hide their locations on the map
Streams, rivers, and creeks: Trinidad Creek (A), Toro Creek (B), Tecolote Creek (C), San Diego Creek (D), Resaca de Enmedio (E), Nopaleras Creek (F), Narciseno Creek (G), Muerto Creek (H), Javelina Creek (I). Display/hide their locations on the map
Neighboring counties: Brevard County, Florida  , Okeechobee County, Florida , Pinellas County, Florida , Jim Wells County , Kenedy County
  , Webb County
  .
.
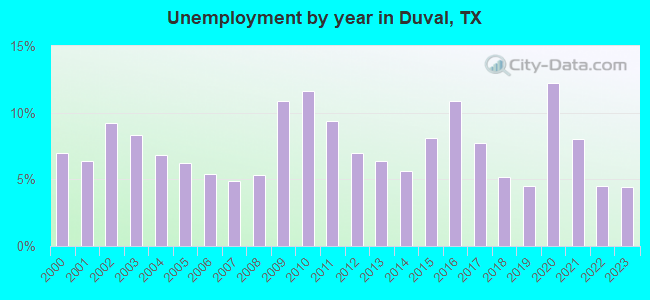
| Here: | 4.1% |
| Texas: | 3.5% |
Current college students: 583
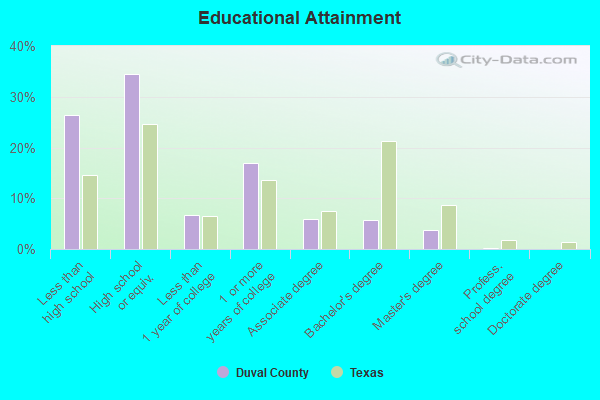
People 25 years of age or older with a high school degree or higher: 73.4%
People 25 years of age or older with a bachelor's degree or higher: 7.8%
Number of foreign born residents: 176 (48.2% naturalized citizens)
| Duval County: | 1.7% |
| Whole state: | 17.2% |
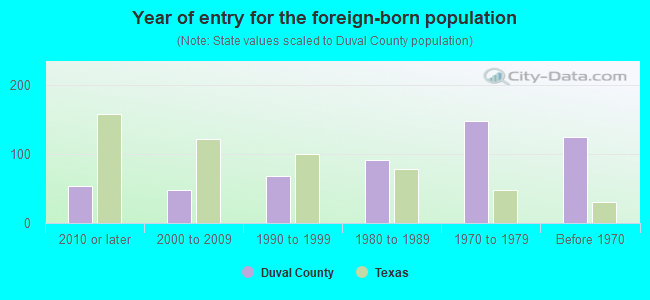
- Year of entry for the foreign-born population
- 52010 or later
- 492000 to 2009
- 191990 to 1999
- 911980 to 1989
- 1481970 to 1979
- 124Before 1970
Mean travel time to work (commute): ! minutes
Percentage of county residents living and working in this county: 97.2%
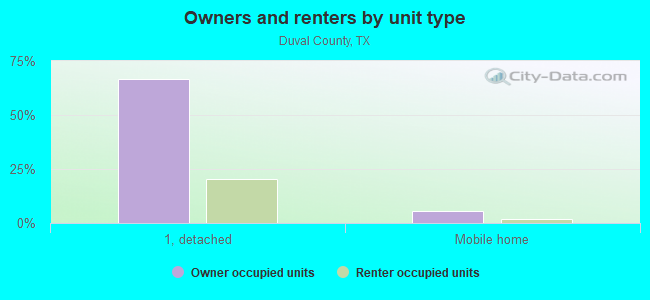
Housing units in structures:
- One, detached: 3,853
- One, attached: 22
- Two: 41
- 3 or 4: 16
- 5 to 9: 109
- 50 or more: 14
- Mobile homes: 553
Housing units in Duval County with a mortgage: 515 (5 second mortgage, 0 home equity loan, 6 both second mortgage and home equity loan)
Houses without a mortgage: 0
| Here: | 100.0% with mortgage |
| State: | 98.4% with mortgage |
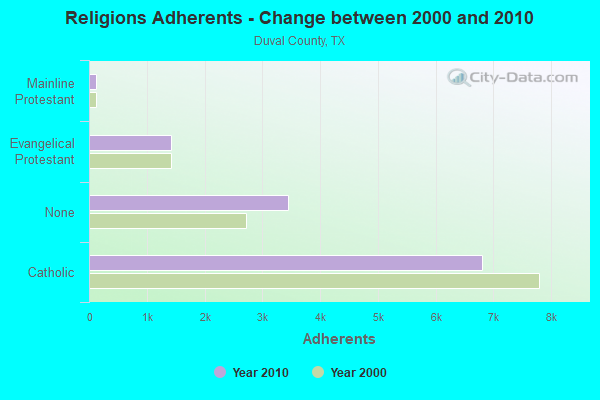
Religion statistics for Duval County
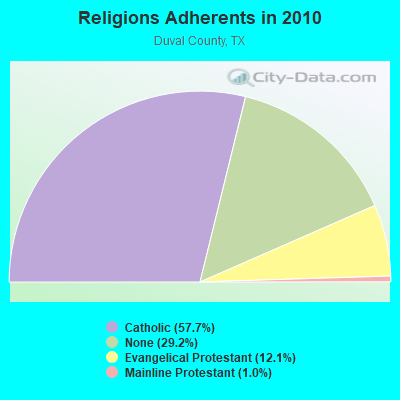
| Religion | Adherents | Congregations |
|---|---|---|
| Catholic | 6,800 | 7 |
| Evangelical Protestant | 1,428 | 9 |
| Mainline Protestant | 113 | 2 |
| Other | - | - |
| None | 3,441 | - |
Source: Clifford Grammich, Kirk Hadaway, Richard Houseal, Dale E.Jones, Alexei Krindatch, Richie Stanley and Richard H.Taylor. 2012. 2010 U.S.Religion Census: Religious Congregations & Membership Study. Association of Statisticians of American Religious Bodies. Jones, Dale E., et al. 2002. Congregations and Membership in the United States 2000. Nashville, TN: Glenmary Research Center.
Food Environment Statistics:
| Duval County: | 2.47 / 10,000 pop. |
| State: | 1.47 / 10,000 pop. |
| This county: | 1.65 / 10,000 pop. |
| Texas: | 1.11 / 10,000 pop. |
| Duval County: | 7.41 / 10,000 pop. |
| Texas: | 3.95 / 10,000 pop. |
| This county: | 4.12 / 10,000 pop. |
| State: | 6.13 / 10,000 pop. |
| Duval County: | 9.3% |
| Texas: | 8.9% |
| Duval County: | 25.9% |
| State: | 26.6% |
| Here: | 11.6% |
| State: | 15.7% |
Agriculture in Duval County:
Average size of farms: 692 acresAverage value of agricultural products sold per farm: $10,546
Average value of crops sold per acre for harvested cropland: $57.48
The value of livestock, poultry, and their products as a percentage of the total market value of agricultural products sold: 85.98%
Average total farm production expenses per farm: $14,912
Harvested cropland as a percentage of land in farms: 3.71%
Average market value of all machinery and equipment per farm: $25,333
The percentage of farms operated by a family or individual: 90.88%
Average age of principal farm operators: 58 years
Average number of cattle and calves per 100 acres of all land in farms: 5.30
Corn for grain: 684 harvested acres
Vegetables: 206 harvested acres
Land in orchards: 103 acres
Tornado activity:
Duval County historical area-adjusted tornado activity is significantly below Texas state average. It is 6839928.5 times below overall U.S. average.Tornadoes in this county have caused one injury recorded between 1950 and 2004.
On 8/10/1980, a category 2 (max. wind speeds 113-157 mph) tornado injured one person and caused between $50,000 and $500,000 in damages.
Earthquake activity:
Duval County-area historical earthquake activity is significantly above Texas state average. It is 43% smaller than the overall U.S. average.On 10/20/2011 at 12:24:41, a magnitude 4.8 (4.8 MW, Depth: 3.1 mi, Class: Light, Intensity: IV - V) earthquake occurred 84.0 miles away from Duval County center
On 4/14/1995 at 00:32:56, a magnitude 5.7 (5.6 MB, 5.7 MS, 5.7 MW, Depth: 11.1 mi, Class: Moderate, Intensity: VI - VII) earthquake occurred 343.0 miles away from the county center
On 4/9/1993 at 12:29:19, a magnitude 4.3 (4.1 MB, 4.3 LG, Depth: 3.1 mi) earthquake occurred 79.6 miles away from the county center
On 4/25/2010 at 02:10:42, a magnitude 3.9 (3.9 MB, Depth: 3.1 mi, Class: Light, Intensity: II - III) earthquake occurred 41.0 miles away from the county center
On 3/24/1997 at 22:31:34, a magnitude 3.8 (3.8 LG, Depth: 3.1 mi) earthquake occurred 28.2 miles away from Duval County center
On 5/1/2018 at 16:28:56, a magnitude 4.0 (4.0 MW, Depth: 3.1 mi) earthquake occurred 90.9 miles away from the county center
Magnitude types: regional Lg-wave magnitude (LG), body-wave magnitude (MB), surface-wave magnitude (MS), moment magnitude (MW)
Most recent natural disasters:
- Texas Covid-19 Pandemic, Incident Period: January 20, 2020, FEMA Id: 4485, Natural disaster type: Other
- Texas Severe Storms, Tornadoes, Straight-line Winds, and Flooding, Incident Period: May 04, 2015 to June 23, 2015, Major Disaster (Presidential) Declared DR-4223: May 29, 2015, FEMA Id: 4223, Natural disaster type: Storm, Tornado, Flood, Wind
- Texas Tropical Storm Alex, Incident Period: June 27, 2010 to August 14, 2010, Emergency Declared EM-3313: June 29, 2010, FEMA Id: 3313, Natural disaster type: Tropical Storm
- Texas Wildfires, Incident Period: March 14, 2008 to September 01, 2008, Emergency Declared EM-3284: March 14, 2008, FEMA Id: 3284, Natural disaster type: Fire
- Texas Hurricane Rita, Incident Period: September 23, 2005 to October 14, 2005, Major Disaster (Presidential) Declared DR-1606: September 24, 2005, FEMA Id: 1606, Natural disaster type: Hurricane
- Texas Hurricane Rita, Incident Period: September 20, 2005 to October 14, 2005, Emergency Declared EM-3261: September 21, 2005, FEMA Id: 3261, Natural disaster type: Hurricane
- Texas Hurricane Katrina, Incident Period: August 29, 2005 to October 01, 2005, Emergency Declared EM-3216: September 02, 2005, FEMA Id: 3216, Natural disaster type: Hurricane
- Texas Severe Storms and Flooding, Incident Period: June 29, 2002 to July 31, 2002, Major Disaster (Presidential) Declared DR-1425: July 04, 2002, FEMA Id: 1425, Natural disaster type: Storm, Flood
- Texas Hurricane Bret, Incident Period: August 21, 1999 to August 26, 1999, Major Disaster (Presidential) Declared DR-1287: August 22, 1999, FEMA Id: 1287, Natural disaster type: Hurricane
- Texas Extreme Fire Hazard, Incident Period: August 30, 1993 to November 15, 1993, Emergency Declared EM-3113: September 10, 1993, FEMA Id: 3113, Natural disaster type: Fire
- 3 other natural disasters have been reported since 1953.
The number of natural disasters in Duval County (13) is near the US average (15).
Major Disasters (Presidential) Declared: 7
Emergencies Declared: 5
Causes of natural disasters: Hurricanes: 6, Floods: 3, Fires: 2, Storms: 2, Winds: 2, Heavy Rain: 1, Tornado: 1, Tropical Storm: 1, Other: 1 (Note: some incidents may be assigned to more than one category).
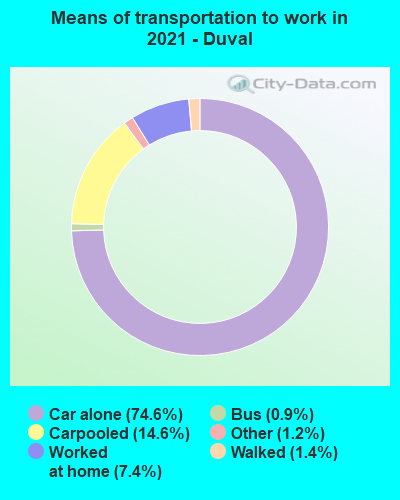
Means of transportation to work:
- Drove a car alone: 1,849 (61.8%)
- Carpooled: 674 (22.5%)
- Bus: 25 (0.8%)
- Taxicab, motorcycle, or other means: 46 (1.5%)
- Walked: 42 (1.4%)
- Worked at home: 363 (12.1%)

- Health care and social assistance (25%)
- Educational services (10%)
- Retail trade (6%)
- Accommodation and food services (6%)
- Public administration (4%)
- Finance and insurance (3%)
- Other services, except public administration (3%)
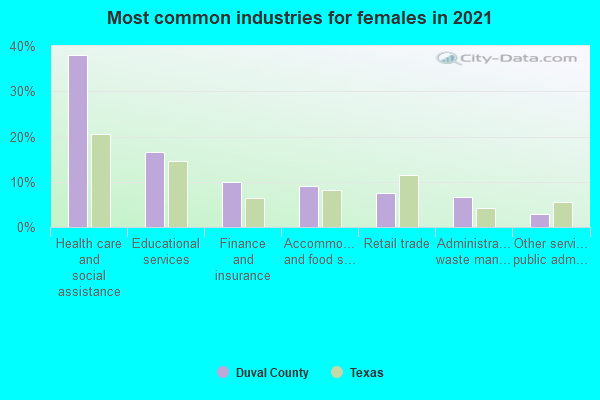
- Health care and social assistance (40%)
- Educational services (16%)
- Retail trade (10%)
- Accommodation and food services (9%)
- Public administration (6%)
- Finance and insurance (5%)
- Other services, except public administration (5%)
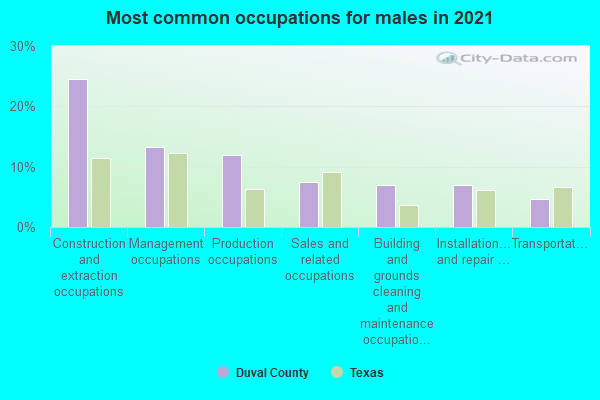
- Construction and extraction occupations (23%)
- Installation, maintenance, and repair occupations (11%)
- Management occupations (10%)
- Production occupations (10%)
- Building and grounds cleaning and maintenance occupations (8%)
- Transportation occupations (5%)
- Sales and related occupations (5%)
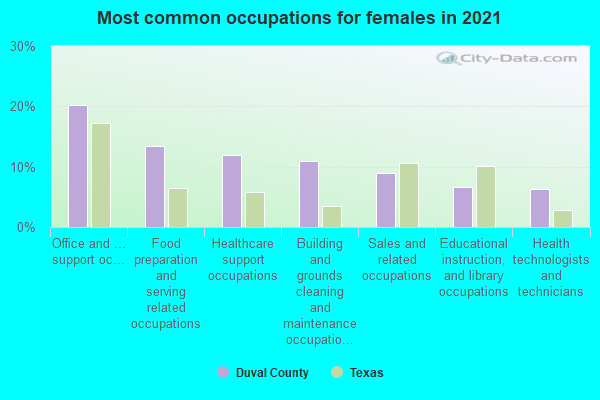
- Office and administrative support occupations (16%)
- Sales and related occupations (12%)
- Food preparation and serving related occupations (12%)
- Healthcare support occupations (8%)
- Business and financial operations occupations (8%)
- Educational instruction, and library occupations (8%)
- Health technologists and technicians (7%)
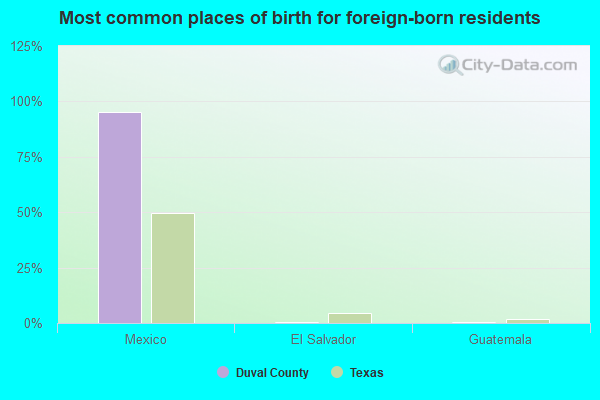
- Mexico (93%)
- El Salvador (2%)
- Guatemala (1%)
- Sweden (0%)
- United Kingdom, excluding England and Scotland (0%)
- England (0%)
- Scotland (0%)
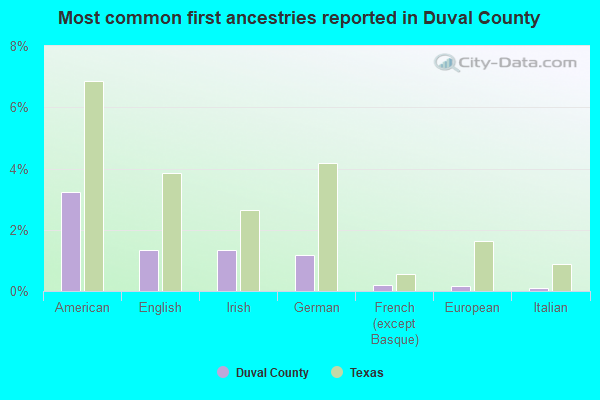
- American (4%)
- German (2%)
- English (1%)
- Irish (1%)
- European (0%)
- Afghan (0%)
- Albanian (0%)
People in group quarters in Duval County, Texas in 2010:
- 514 people in state prisons
- 62 people in nursing facilities/skilled-nursing facilities
- 2 people in emergency and transitional shelters (with sleeping facilities) for people experiencing homelessness
People in group quarters in Duval County, Texas in 2000:
- 503 people in other types of correctional institutions
- 47 people in nursing homes
- 11 people in local jails and other confinement facilities (including police lockups)
- 11 people in training schools for juvenile delinquents
- 11 people in other nonhousehold living situations
5.29% of this county's 2021 resident taxpayers lived in other counties in 2020 ($35,508 average adjusted gross income)
| Here: | 5.29% |
| Texas average: | 8.12% |
10 or fewer of this county's residents moved from foreign countries.
5.29% relocated from other counties in Texas ($35,508 average AGI)
10 or fewer of this county's residents relocated from other states.

Top counties from which taxpayers relocated into this county between 2020 and 2021:
| from Jim Wells County, TX | |
| from Nueces County, TX |
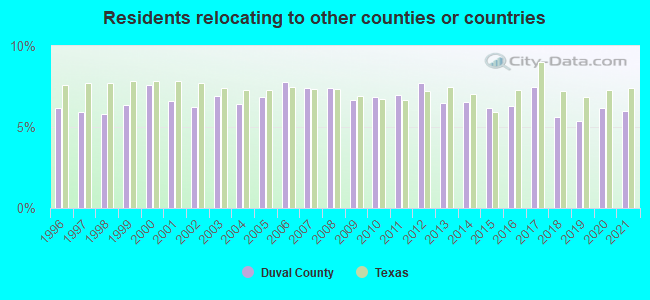
5.97% of this county's 2020 resident taxpayers moved to other counties in 2021 ($35,710 average adjusted gross income)
| Here: | 5.97% |
| Texas average: | 7.40% |
10 or fewer of this county's residents moved to foreign countries.
5.97% relocated to other counties in Texas ($35,710 average AGI)
10 or fewer of this county's residents relocated to other states.
Top counties to which taxpayers relocated from this county between 2020 and 2021:
| to Jim Wells County, TX | |
| to Nueces County, TX |
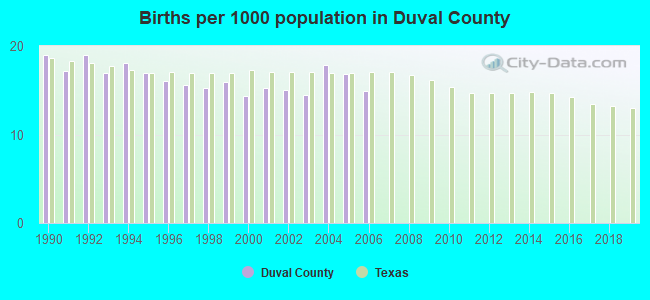
Births per 1000 population from 1990 to 1999: 17.0
Births per 1000 population from 2000 to 2006: 15.5
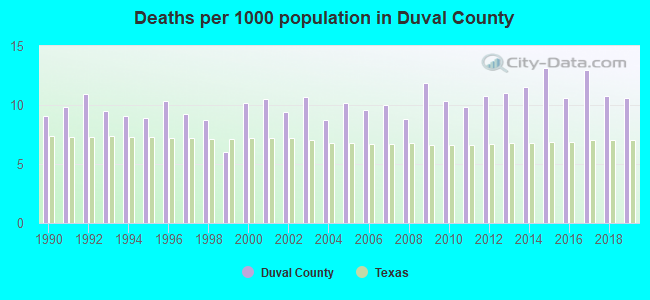
Deaths per 1000 population from 1990 to 1999: 9.2
Deaths per 1000 population from 2000 to 2009: 10.0
Deaths per 1000 population from 2010 to 2020: 11.3
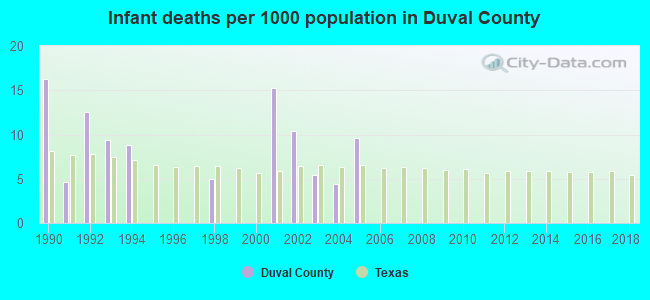
Infant deaths per 1000 live births from 1990 to 1999: 5.7
Infant deaths per 1000 live births from 2000 to 2006: 6.4
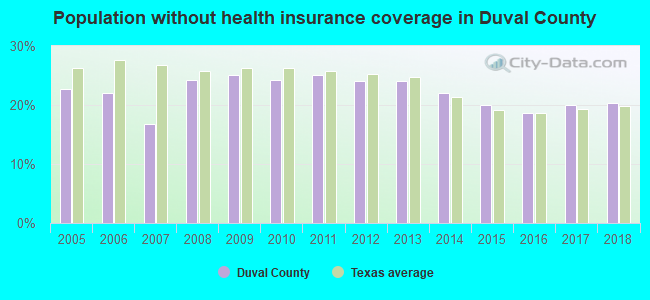
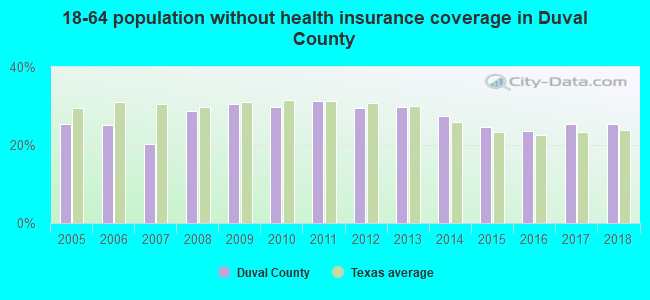
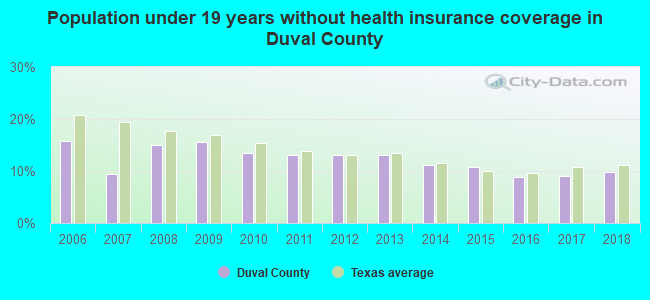
Persons under 19 years old without health insurance coverage in 2018: 9.8%
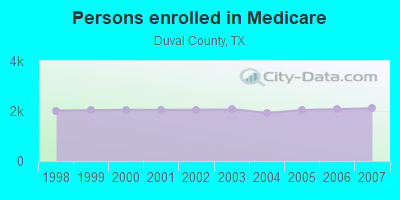
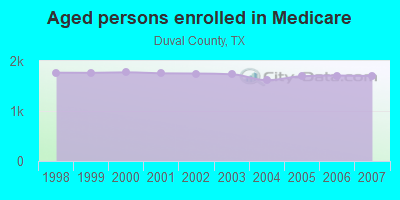
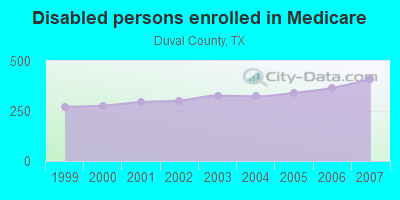
Persons enrolled in hospital insurance and/or supplemental medical insurance (Medicare) in July 1, 2007: 2,110 (1,700 aged, 410 disabled)
Children under 18 without health insurance coverage in 2007: 265 (8%)
Most common underlying causes of death in Duval County, Texas in 1999 - 2019:
- Acute myocardial infarction, unspecified (202)
- Atherosclerotic heart disease (96)
- Unspecified diabetes mellitus, without complications (32)
- Alzheimer disease, unspecified (24)
- Bronchus or lung, unspecified - Malignant neoplasms (10)
Population without health insurance coverage in 2000: 25%
Children under 18 without health insurance coverage in 2000: 26%
Medical specialist MDs per 100,000 population in 2005: 819
Dentists per 100,000 population in 1998: 8
Total deaths per 100,000 population, July 2005 - July 2006: 56
Crimes per 100,000 population in 1996: 1
Household type by relationship:
Households: 10,227- Male householders: 1,358 (427 living alone), Female householders: 1,701 (665 living alone)
1,294 spouses (1,294 opposite-sex spouses), 207 unmarried partners, (207 opposite-sex unmarried partners), 3,428 children (3,246 natural, 55 adopted, 125 stepchildren), 382 grandchildren, 260 brothers or sisters, 94 parents, 0 foster children, 465 other relatives, 391 non-relatives
- In group quarters: 551
Size of family households: 598 2-persons, 657 3-persons, 215 4-persons, 189 5-persons, 97 6-persons, 66 7-or-more-persons.
Size of nonfamily households: 1,092 1-person, 94 2-persons, 46 5-persons.
1,140 married couples with children.
779 single-parent households (99 men, 680 women).
43.0% of residents of Duval speak English at home.
57.3% of residents speak Spanish at home (86% speak English very well, 7% speak English well, 5% speak English not well, 2% don't speak English at all).
0.4% of residents speak other Indo-European language at home (100% speak English very well).
In fiscal year 2004:
Federal Government expenditure: $115,382,000 ($9,107 per capita)
Department of Defense expenditure: $1,635,000
Federal direct payments to individuals for retirement and disability: $28,177,000
Federal other direct payments to individuals: $29,241,000
Federal direct payments not to individuals: $2,340,000
Federal grants: $48,278,000
Federal procurement contracts: $1,510,000 ($834,000 Department of Defense)
Federal salaries and wages: $5,837,000 ($0,000 Department of Defense)
Federal Government direct loans: $327,000
Federal guaranteed/insured loans: $1,781,000
Federal Government insurance: $6,445,000
Population change from April 1, 2000 to July 1, 2005:
Births: 971| Here: | 77 per 1000 residents |
| State: | 85 per 1000 residents |
Deaths: 614
| Here: | 49 per 1000 residents |
| State: | 35 per 1000 residents |
Net international migration: +24
| Here: | +2 per 1000 residents |
| State: | +29 per 1000 residents |
Net internal migration: -894
| Here: | |
| State: |
Total withdrawal of fresh water for public supply: 1.70 millions of gallons per day (all from ground)
| Here: | 5.5 |
| State: | 6.3 |
| Here: | 4.6 |
| State: | 4.0 |
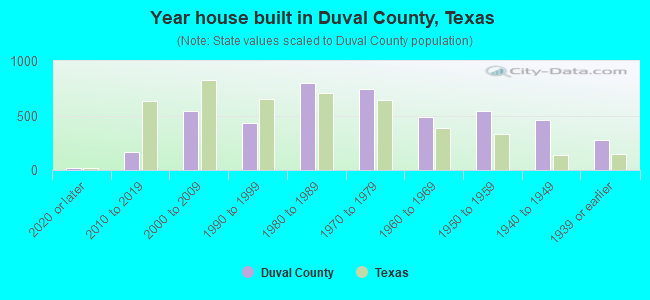
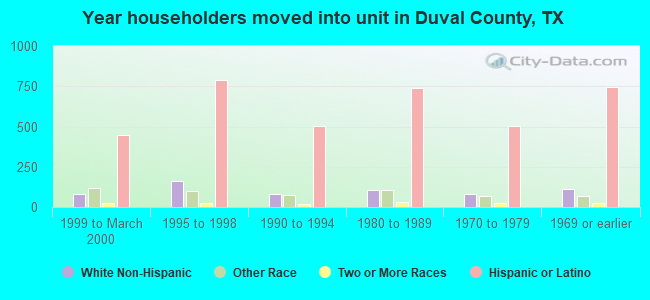
- Year house built in Duval County, Texas
- 282020 or later
- 592010 to 2019
- 5542000 to 2009
- 4931990 to 1999
- 8441980 to 1989
- 7961970 to 1979
- 4231960 to 1969
- 5461950 to 1959
- 3271940 to 1949
- 2721939 or earlier
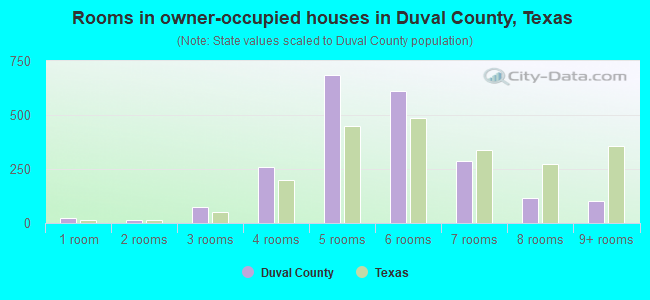
- Rooms in owner-occupied houses in Duval County, Texas
- 331 room
- 72 rooms
- 853 rooms
- 3204 rooms
- 6495 rooms
- 5886 rooms
- 3267 rooms
- 928 rooms
- 829+ rooms
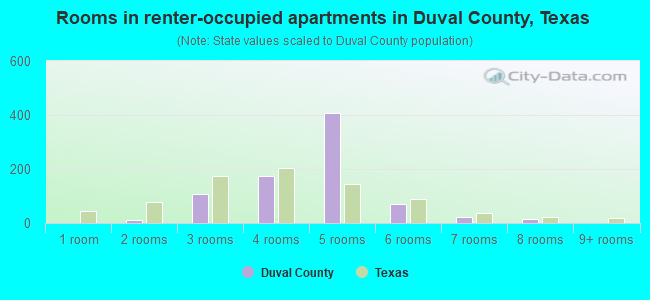
- Rooms in renter-occupied apartments in Duval County, Texas
- 01 room
- 362 rooms
- 573 rooms
- 2304 rooms
- 4455 rooms
- 286 rooms
- 337 rooms
- 198 rooms
- 09+ rooms
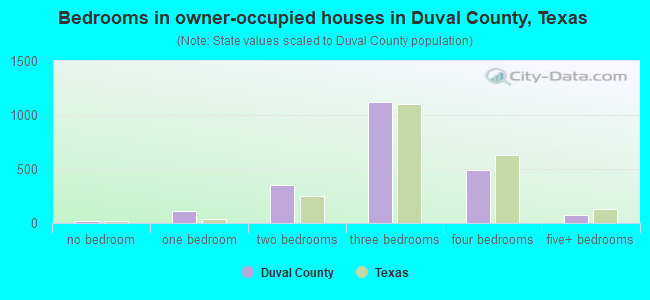
- Bedrooms in owner-occupied houses in Duval County, Texas
- 36no bedroom
- 1031 bedroom
- 4102 bedrooms
- 1,0953 bedrooms
- 4734 bedrooms
- 595+ bedrooms
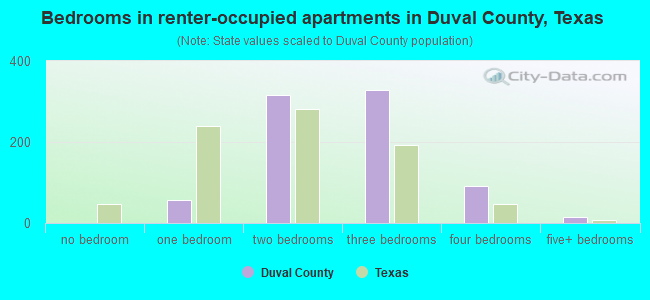
- Bedrooms in renter-occupied apartments in Duval County, Texas
- 0no bedroom
- 671 bedroom
- 3232 bedrooms
- 3703 bedrooms
- 724 bedrooms
- 275+ bedrooms
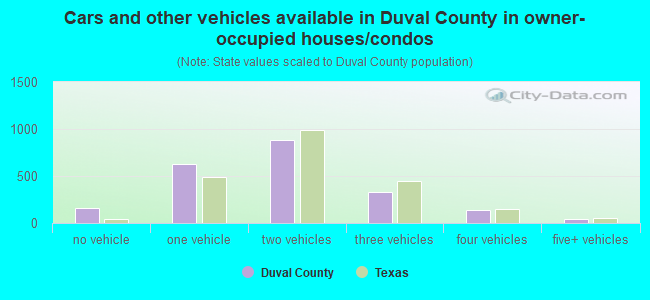
- Cars and other vehicles available in Duval County in owner-occupied houses/condos
- 172no vehicle
- 6461 vehicle
- 8992 vehicles
- 2783 vehicles
- 1784 vehicles
- 235+ vehicles

- Cars and other vehicles available in Duval County in renter-occupied apartments
- 153no vehicle
- 3741 vehicle
- 1002 vehicles
- 2293 vehicles
- 174 vehicles
- 05+ vehicles
89.2% of Duval County residents lived in the same house 1 years ago.
Out of people who lived in different houses, 8% lived in this county.
Out of people who lived in different counties, 100% lived in Texas.
| Duval County: | 89.2% |
| State average: | 85.7% |
Place of birth for U.S.-born residents:
- This state: 9,652
- Other state: 244
- Northeast: 15
- Midwest: 45
- South: 21
- West: 166
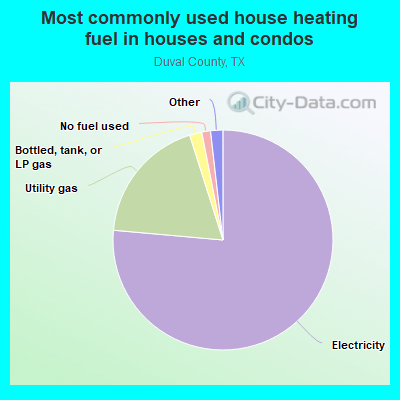
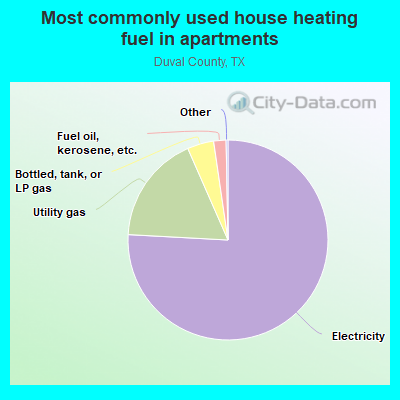
- 79.7%Electricity
- 16.5%Utility gas
- 1.7%No fuel used
- 0.9%Bottled, tank, or LP gas
- 0.5%Solar energy
- 0.3%Other fuel
- 0.3%Fuel oil, kerosene, etc.
- 82.7%Electricity
- 7.7%Utility gas
- 5.3%Fuel oil, kerosene, etc.
- 4.3%Bottled, tank, or LP gas
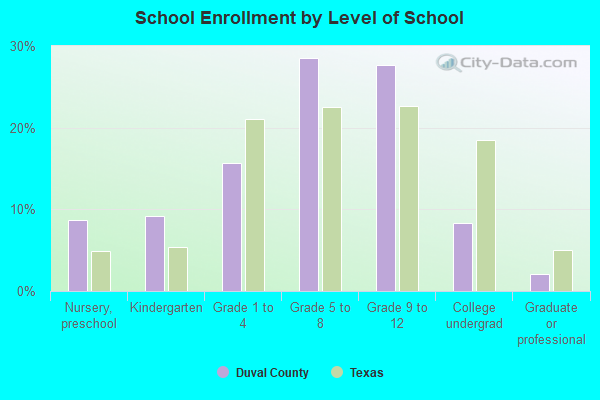
Private vs. public school enrollment:
| Here: | 2.9% |
| Texas: | 8.8% |
| Here: | 0.0% |
| Texas: | 8.0% |
| Here: | 7.0% |
| Texas: | 16.2% |
Duval County government finances - Expenditure in 2020:
- Charges - Other: $1,798,000
Other: $1,724,000
- Current Operations - Regular Highways: $4,516,000
Regular Highways: $4,084,000
General - Other: $2,772,000
Correctional Institutions: $2,748,000
General - Other: $2,507,000
Correctional Institutions: $2,485,000
Police Protection: $2,113,000
Police Protection: $1,911,000
Judicial and Legal Services: $1,443,000
Judicial and Legal Services: $1,305,000
Parks and Recreation: $991,000
Health - Other: $987,000
Parks and Recreation: $896,000
Health - Other: $893,000
Financial Administration: $682,000
Financial Administration: $617,000
Public Welfare - Other: $346,000
Public Welfare - Other: $313,000
Central Staff Services: $248,000
Central Staff Services: $224,000
Libraries: $81,000
Libraries: $74,000
- General - Interest on Debt: $29,000
Interest on Debt: $29,000
- Long Term Debt - Beginning Outstanding - Unspecified Public Purpose: $721,000
Outstanding Unspecified Public Purpose: $679,000
Beginning Outstanding - Unspecified Public Purpose: $637,000
Outstanding Unspecified Public Purpose: $595,000
Retired Unspecified Public Purpose: $42,000
Retired Unspecified Public Purpose: $42,000
- Miscellaneous - General Revenue - Other: $926,000
General Revenue - Other: $758,000
Interest Earnings: $24,000
Interest Earnings: $20,000
- Other Capital Outlay - Regular Highways: $259,000
Regular Highways: $209,000
General - Other: $42,000
General - Other: $34,000
Correctional Institutions: $32,000
Correctional Institutions: $26,000
- Other Funds - Cash and Securities: $3,057,000
Cash and Securities: $2,835,000
- State Intergovernmental - Other: $865,000
Highways: $856,000
Other: $547,000
Highways: $541,000
Health and Hospitals: $67,000
Public Welfare: $63,000
Health and Hospitals: $42,000
Public Welfare: $40,000
- Tax - Property: $9,268,000
Property: $8,095,000
Motor Vehicle License: $592,000
Motor Vehicle License: $517,000
Other License: $90,000
Other License: $78,000
Occupation and Business License - Other: $76,000
Occupation and Business License - Other: $66,000
- Total Salaries and Wages: $8,116,000
: $7,934,000
Duval County government finances - Revenue in 2020:
- Charges - Other: $1,798,000
Other: $1,724,000
- Current Operations - Regular Highways: $4,516,000
Regular Highways: $4,084,000
General - Other: $2,772,000
Correctional Institutions: $2,748,000
General - Other: $2,507,000
Correctional Institutions: $2,485,000
Police Protection: $2,113,000
Police Protection: $1,911,000
Judicial and Legal Services: $1,443,000
Judicial and Legal Services: $1,305,000
Parks and Recreation: $991,000
Health - Other: $987,000
Parks and Recreation: $896,000
Health - Other: $893,000
Financial Administration: $682,000
Financial Administration: $617,000
Public Welfare - Other: $346,000
Public Welfare - Other: $313,000
Central Staff Services: $248,000
Central Staff Services: $224,000
Libraries: $81,000
Libraries: $74,000
- General - Interest on Debt: $29,000
Interest on Debt: $29,000
- Long Term Debt - Beginning Outstanding - Unspecified Public Purpose: $721,000
Outstanding Unspecified Public Purpose: $679,000
Beginning Outstanding - Unspecified Public Purpose: $637,000
Outstanding Unspecified Public Purpose: $595,000
Retired Unspecified Public Purpose: $42,000
Retired Unspecified Public Purpose: $42,000
- Miscellaneous - General Revenue - Other: $926,000
General Revenue - Other: $758,000
Interest Earnings: $24,000
Interest Earnings: $20,000
- Other Capital Outlay - Regular Highways: $259,000
Regular Highways: $209,000
General - Other: $42,000
General - Other: $34,000
Correctional Institutions: $32,000
Correctional Institutions: $26,000
- Other Funds - Cash and Securities: $3,057,000
Cash and Securities: $2,835,000
- State Intergovernmental - Other: $865,000
Highways: $856,000
Other: $547,000
Highways: $541,000
Health and Hospitals: $67,000
Public Welfare: $63,000
Health and Hospitals: $42,000
Public Welfare: $40,000
- Tax - Property: $9,268,000
Property: $8,095,000
Motor Vehicle License: $592,000
Motor Vehicle License: $517,000
Other License: $90,000
Other License: $78,000
Occupation and Business License - Other: $76,000
Occupation and Business License - Other: $66,000
- Total Salaries and Wages: $8,116,000
: $7,934,000
Duval County government finances - Debt in 2020:
- Charges - Other: $1,798,000
Other: $1,724,000
- Current Operations - Regular Highways: $4,516,000
Regular Highways: $4,084,000
General - Other: $2,772,000
Correctional Institutions: $2,748,000
General - Other: $2,507,000
Correctional Institutions: $2,485,000
Police Protection: $2,113,000
Police Protection: $1,911,000
Judicial and Legal Services: $1,443,000
Judicial and Legal Services: $1,305,000
Parks and Recreation: $991,000
Health - Other: $987,000
Parks and Recreation: $896,000
Health - Other: $893,000
Financial Administration: $682,000
Financial Administration: $617,000
Public Welfare - Other: $346,000
Public Welfare - Other: $313,000
Central Staff Services: $248,000
Central Staff Services: $224,000
Libraries: $81,000
Libraries: $74,000
- General - Interest on Debt: $29,000
Interest on Debt: $29,000
- Long Term Debt - Beginning Outstanding - Unspecified Public Purpose: $721,000
Outstanding Unspecified Public Purpose: $679,000
Beginning Outstanding - Unspecified Public Purpose: $637,000
Outstanding Unspecified Public Purpose: $595,000
Retired Unspecified Public Purpose: $42,000
Retired Unspecified Public Purpose: $42,000
- Miscellaneous - General Revenue - Other: $926,000
General Revenue - Other: $758,000
Interest Earnings: $24,000
Interest Earnings: $20,000
- Other Capital Outlay - Regular Highways: $259,000
Regular Highways: $209,000
General - Other: $42,000
General - Other: $34,000
Correctional Institutions: $32,000
Correctional Institutions: $26,000
- Other Funds - Cash and Securities: $3,057,000
Cash and Securities: $2,835,000
- State Intergovernmental - Other: $865,000
Highways: $856,000
Other: $547,000
Highways: $541,000
Health and Hospitals: $67,000
Public Welfare: $63,000
Health and Hospitals: $42,000
Public Welfare: $40,000
- Tax - Property: $9,268,000
Property: $8,095,000
Motor Vehicle License: $592,000
Motor Vehicle License: $517,000
Other License: $90,000
Other License: $78,000
Occupation and Business License - Other: $76,000
Occupation and Business License - Other: $66,000
- Total Salaries and Wages: $8,116,000
: $7,934,000
Duval County government finances - Cash and Securities in 2020:
- Charges - Other: $1,798,000
Other: $1,724,000
- Current Operations - Regular Highways: $4,516,000
Regular Highways: $4,084,000
General - Other: $2,772,000
Correctional Institutions: $2,748,000
General - Other: $2,507,000
Correctional Institutions: $2,485,000
Police Protection: $2,113,000
Police Protection: $1,911,000
Judicial and Legal Services: $1,443,000
Judicial and Legal Services: $1,305,000
Parks and Recreation: $991,000
Health - Other: $987,000
Parks and Recreation: $896,000
Health - Other: $893,000
Financial Administration: $682,000
Financial Administration: $617,000
Public Welfare - Other: $346,000
Public Welfare - Other: $313,000
Central Staff Services: $248,000
Central Staff Services: $224,000
Libraries: $81,000
Libraries: $74,000
- General - Interest on Debt: $29,000
Interest on Debt: $29,000
- Long Term Debt - Beginning Outstanding - Unspecified Public Purpose: $721,000
Outstanding Unspecified Public Purpose: $679,000
Beginning Outstanding - Unspecified Public Purpose: $637,000
Outstanding Unspecified Public Purpose: $595,000
Retired Unspecified Public Purpose: $42,000
Retired Unspecified Public Purpose: $42,000
- Miscellaneous - General Revenue - Other: $926,000
General Revenue - Other: $758,000
Interest Earnings: $24,000
Interest Earnings: $20,000
- Other Capital Outlay - Regular Highways: $259,000
Regular Highways: $209,000
General - Other: $42,000
General - Other: $34,000
Correctional Institutions: $32,000
Correctional Institutions: $26,000
- Other Funds - Cash and Securities: $3,057,000
Cash and Securities: $2,835,000
- State Intergovernmental - Other: $865,000
Highways: $856,000
Other: $547,000
Highways: $541,000
Health and Hospitals: $67,000
Public Welfare: $63,000
Health and Hospitals: $42,000
Public Welfare: $40,000
- Tax - Property: $9,268,000
Property: $8,095,000
Motor Vehicle License: $592,000
Motor Vehicle License: $517,000
Other License: $90,000
Other License: $78,000
Occupation and Business License - Other: $76,000
Occupation and Business License - Other: $66,000
- Total Salaries and Wages: $8,116,000
: $7,934,000
Supplemental Security Income (SSI) in 2006:
- Total number of recipients: 784
- Number of aged recipients: 201
- Number of blind and disabled recipients: 583
- Number of recipients under 18: 69
- Number of recipients between 18 and 64: 374
- Number of recipients older than 64: 341
- Number of recipients also receiving OASDI: 380
- Amount of payments (thousands of dollars): 301
| Most common first names in Duval County, TX among deceased individuals | ||
| Name | Count | Lived (average) |
|---|---|---|
| Maria | 131 | 76.6 years |
| Jose | 85 | 71.1 years |
| Juan | 66 | 72.7 years |
| Guadalupe | 50 | 76.7 years |
| Jesus | 40 | 73.8 years |
| Pedro | 39 | 75.3 years |
| Manuel | 35 | 72.4 years |
| Francisco | 29 | 75.2 years |
| Antonio | 29 | 75.9 years |
| Ramon | 24 | 68.1 years |
| Most common last names in Duval County, TX among deceased individuals | ||
| Last name | Count | Lived (average) |
|---|---|---|
| Garcia | 250 | 76.8 years |
| Perez | 119 | 72.8 years |
| Garza | 111 | 72.8 years |
| Gonzalez | 106 | 75.7 years |
| Salinas | 73 | 74.5 years |
| Cantu | 62 | 75.9 years |
| Trevino | 59 | 71.4 years |
| Saenz | 55 | 76.4 years |
| Alaniz | 50 | 74.2 years |
| Hinojosa | 48 | 75.1 years |
| Businesses in Duval County, TX | ||||
| Name | Count | Name | Count | |
|---|---|---|---|---|
| Best Western | 1 | FedEx | 1 | |
| Chevrolet | 1 | U-Haul | 1 | |
| Dairy Queen | 1 | |||
Duval County on our top lists:
- #45 on the list of "Top 101 counties with highest percentage of residents voting for Obama (Democrat) in the 2012 Presidential Election"