The comparison between Washington, DC and Worcester, MA considers aspects such as crime/safety, cost of living, and quality of education, among others. Both cities have their unique features and dissimilarities, which could appeal to different individuals depending on their preferences and circumstances. Whether you are planning to relocate for work, school or retirement, or even if you're just visiting, it is important to understand what each city offers.
Distance between
Washington, DC and
Worcester, MA : 358.3 miles
Washington's population is larger by 225%. Its population has grown by 97,991 people (17.1%) since 2000. The population of Worcester has grown by 33,270 people (19.3%) during that time.
Washington DC, as a larger city with a higher population density, tends to have a higher crime rate compared to Worcester, MA. However, crime rates differ greatly among neighborhoods within the city. Both cities have invested in community policing and other initiatives to enhance safety. For tourists, it is always advisable to stay aware of your surroundings and stick to well-populated areas, particularly at night.
City-data.com crime index counts serious crimes and violent crime more heavily. It adjusts for the number of visitors and daily workers commuting into cities. (higher means more crime, U.S. average = 301.1)
City-data.com crime index counts serious crimes and violent crime more heavily. It adjusts for the number of visitors and daily workers commuting into cities. (higher means more crime, U.S. average = 301.1)
Sex Offenders
According to our data, there are 1,058 registered sex offenders living in Washington and 242 registered sex offenders living in . The ratio of residents to sex offenders in Washington is 644 to 1; the ratio in Worcester is 762 to 1. The number of registered sex offenders compared to the number of residents in Washington is near to than in Worcester.
Cost of Living
The cost of living in Washington DC is significantly higher than in Worcester, MA. This includes expenses relating to housing, food, transportation, and health care. However, wages and salaries also tend to be higher in Washington DC, which can offset some of the increased cost of living.
Income Tax
Both locations impose income taxes, with DC having a progressive income tax rate, and Massachusetts levying a flat rate. This could have differing impacts on your take-home pay depending on your income bracket.
Property Tax
Property taxes differ considerably, with Washington DC's rates generally lower than Worcester's. However, the higher property values in DC often mean that homeowners might still pay more in absolute terms.
Sales Tax
Sales tax in Washington DC stands at 6% and Massachusetts has a state sales tax rate of 6.25%. However, Worcester has no additional local sales tax.
Income
Type
Washington
Worcester
Estimated median household income
$90,088
$63,194
Estimated per capita income
$65,808
$32,772
Cost of living index (U.S. average is 100)
124.2
128.3
If you make $50,000 in Washington, you will have to make $51,651 in Worcester to maintain the same standard of living.
Geographical Conditions
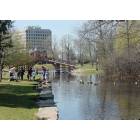
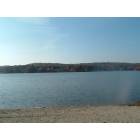
Washington, DC is situated along the east coast and is relatively flat with a few rolling hills, while Worcester is located in central Massachusetts and is known for its hilly terrain and numerous ponds and lakes.
Washington DC is home to numerous internationally recognized universities and colleges, including Georgetown and George Washington Universities. Worcester has fewer higher education institutions, but they include the reputed Worcester Polytechnic Institute and Clark University. Both cities have public school systems that vary in quality, with some schools being very highly rated.
Washington DC's economy is driven largely by government jobs, but also features strong sectors in professional services, education, and health care. On the other hand, Worcester's economy is more diversified, with health care, education, and manufacturing playing significant roles.
Biggest Employers
The biggest employers in Washington DC are the federal government and educational and medical institutions. Meanwhile, in Worcester, the University of Massachusetts Medical Center and Hanover Insurance are among the top employers.
There were 376 building permits issued in Washington in 2012 (149 more than in 2011) compared to 66 building permits issued in Worcester in 2012 (2 more than in 2011).
In Washington (District of Columbia), 90.9% voted for Democrats and 7.3% for Republicans in 2012 Presidential Election. In Worcester (Worcester County), 53.7% voted for Democrats and 44.3% for Republicans.
Elections
Type
Democrats
Republicans
Other
Year
Washington
Worcester
Washington
Worcester
Washington
Worcester
2020
92.6%
57.6%
5.4%
39.7%
2.0%
2.7%
2016
90.9%
51.0%
4.1%
40.5%
5.0%
8.5%
2012
90.9%
53.7%
7.3%
44.3%
1.8%
2.0%
2008
92.5%
55.8%
6.5%
42.0%
1.0%
2.2%
2004
89.6%
56.6%
9.4%
42.5%
1.0%
0.9%
2000
85.2%
56.2%
9.0%
36.9%
5.9%
6.9%
1996
85.2%
58.3%
9.3%
29.8%
5.5%
11.9%
Breakdown of population affiliated with a religious congregation
Type
Adherents
Congregations
Religion
Washington
Worcester
Washington
Worcester
CATHOLIC CHURCH
12.6%
38.4%
7.4%
20.1%
AMERICAN BAPTIST CHURCHES IN THE USA
6.2%
0.7%
10.3%
4.6%
SOUTHERN BAPTIST CONVENTION
4.4%
0.2%
10.3%
3.3%
EPISCOPAL CHURCH
3.1%
1.2%
5.3%
4.8%
SEVENTH DAY ADVENTIST CHURCH
0.9%
0.8%
1.8%
4.6%
MUSLIM ESTIMATE
0.7%
0.1%
1.1%
0.3%
EVANGELICAL LUTHERAN CHURCH IN AMERICA
0.5%
0.8%
2.1%
2.2%
Weather
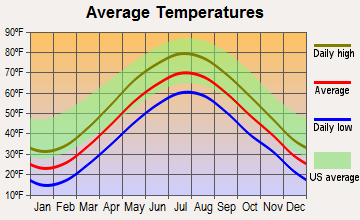
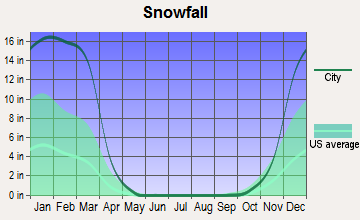
Climate conditions in both Washington, DC and Worcester, MA are characterized by four distinct seasons. However, Washington DC generally has milder winters and hotter summers. Worcester, being in New England, often experiences significant snowfall and colder winter temperatures. Both cities celebrate the beauty of fall foliage, which can be a treat for residents and visitors alike.
Weather and climate
Type
Washington
Worcester
Temperature - Average
56.4°F
47.1°F
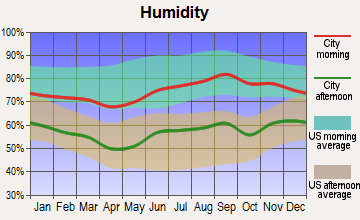
Humidity - Average morning or afternoon humidity
68.8%
71.5%
Humidity - Differences between morning and afternoon humidity
33%
32%
Humidity - Maximum monthly morning or afternoon humidity
81%
81%
Humidity - Minimum monthly morning or afternoon humidity
48%
49.1%
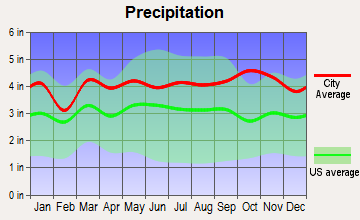
Precipitation - Yearly average
42.7 in
48.9 in
Snowfall - Yearly average
32.4 in
133.4 in
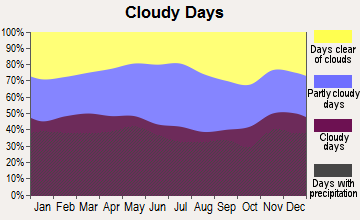
Clouds - Number of days clear of clouds
15.9%
15.2%
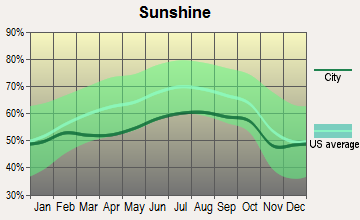
Sunshine amount - Average
61.5%
63%
Sunshine amount - Differences during a year
21%
18.5%
Sunshine amount - Maximum monthly
66%
66.3%
Sunshine amount - Minimum monthly
45%
47.8%
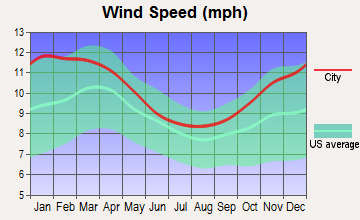
Wind speed - Average
9.7 mph
11 mph
Average climate in Washington, District of Columbia
Average climate in Worcester, Massachusetts
Air pollution
Type
AQI
CO
NO2
OZONE
PB
PM10
PM25
SO2
Year
Washington
Worcester
Washington
Worcester
Washington
Worcester
Washington
Worcester
Washington
Washington
Washington
Worcester
Washington
Worcester
2018
88
71
0.32
0.28
11.6
11.2
23.2
31.5
N/A
N/A
16.4
N/A
8.8
6.8
0.8
0.6
2017
84
69
0.32
0.28
12.3
11.5
24.9
32.3
N/A
N/A
16.5
N/A
9.8
5.5
1.0
0.8
2016
98
73
0.43
0.25
14.7
12.2
24.6
33.6
0.002
N/A
17.2
N/A
9.5
6.2
1.0
0.7
2015
91
68
0.34
0.26
14.8
13.4
26.2
32.6
0.002
N/A
17.0
N/A
10.4
7.0
1.3
0.5
2014
85
71
0.33
0.32
11.6
13.1
25.9
33.2
0.002
N/A
17.1
N/A
10.0
7.7
1.0
1.5
2013
88
82
0.34
0.39
11.7
11.8
25.6
34.5
0.002
N/A
17.3
N/A
11.6
8.3
1.0
2.7
2012
103
84
0.58
0.51
15.2
12.8
27.6
37.5
0.002
N/A
N/A
N/A
12.2
7.7
1.6
3.2
2011
105
82
0.67
0.46
15.4
17.4
27.7
34.8
0.002
N/A
N/A
N/A
11.4
9.8
3.1
2.7
2010
114
88
0.88
0.50
15.9
13.9
29.3
37.4
0.003
N/A
N/A
N/A
9.3
9.9
3.4
2.1
2009
90
85
0.86
0.53
16.2
14.4
24.4
N/A
0.002
N/A
N/A
N/A
7.6
8.3
4.6
1.1
2008
103
94
1.23
0.54
16.2
14.9
25.3
38.5
0.003
N/A
N/A
N/A
8.5
8.0
5.6
2.6
2007
113
115
1.17
0.52
16.8
15.7
27.1
N/A
0.004
N/A
N/A
N/A
10.4
9.0
5.1
3.4
2006
114
98
1.11
0.53
17.2
15.2
25.5
38.7
0.004
N/A
N/A
N/A
10.9
8.8
4.5
2.8
2005
105
101
0.86
0.55
20.5
14.9
22.7
N/A
0.006
N/A
N/A
N/A
11.7
10.0
4.5
4.6
2004
113
92
0.62
0.41
21.3
15.8
20.6
N/A
0.004
N/A
N/A
N/A
11.3
11.6
6.5
2.6
2003
108
82
0.90
0.51
23.6
15.6
20.8
N/A
N/A
N/A
N/A
N/A
12.2
N/A
8.3
N/A
2002
125
87
1.16
0.52
23.7
17.4
25.0
39.0
N/A
N/A
N/A
N/A
N/A
N/A
6.7
N/A
2001
113
98
1.07
0.57
23.9
20.0
22.0
32.6
0.017
N/A
N/A
N/A
N/A
N/A
6.7
N/A
2000
115
76
1.17
0.52
20.2
18.6
19.1
31.2
N/A
N/A
N/A
N/A
N/A
N/A
8.2
N/A
Natural disasters
Type
Washington
Worcester
Tornado activity compared to U.S. average
110.6%
79.8%
Earthquake activity compared to U.S. average
42.9%
28.4%
Natural disasters compared to U.S. average
19%
27%
Transportation
Public Transport and easy commuting are strengths for Washington DC with its developed Metro system. Worcester, however, relies more heavily on driving with less developed public transport, but has significantly less traffic congestion.
Transport
Type
Washington
Worcester
Amtrak stations
1
0
Amtrak stations nearby
3
2
FAA registered aircraft
456
21
FAA registered aircraft manufacturers and dealers
3
9
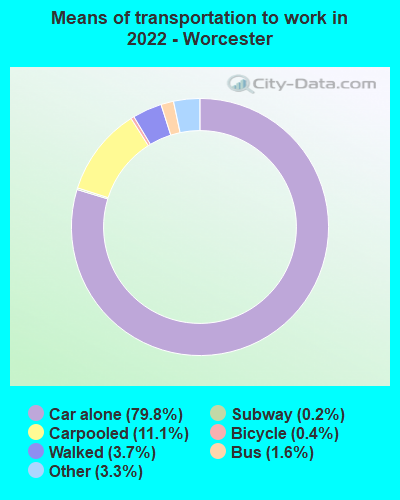
Means of transportation to work
Type
Washington
Worcester
Bicycle
2%
0.4%
Bus
6.3%
1.3%
Carpooled
7.8%
9.8%
Car alone
62.5%
81.3%
Railroad
0.3%
0.4%
Streetcar
10.6%
0%
Subway
1.3%
0.1%
Taxicab
0.8%
0.4%
Walked
5.7%
4.6%
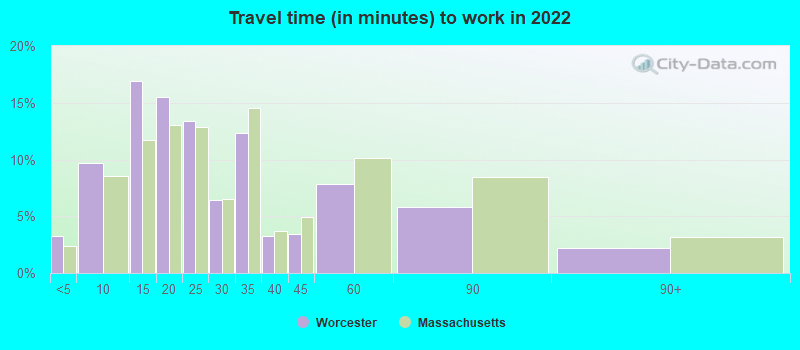
Average travel time to work
Type
Washington
Worcester
Average
39.2 min
26.5 min
Other means
26 min
23.3 min
Public transportation
38.9 min
34 min
Private vehicle occupancy
Type
Washington
Worcester
Average
1.1
1.2
Drove alone
89.4%
85.3%
In 2 person carpool
9.7%
11.9%
In 3 person carpool
0.6%
1.6%
In 4 person carpool
0.4%
0.6%
In 5-6 person carpool
0%
0.3%
In 7+ person carpool
0%
0.2%
How many people usually rode to work in the car, truck or van.
Real Estate
Real estate prices in Washington DC are among the highest in the country, with a competitive and fast-paced housing market. Worcester offers a more affordable housing market, which could be advantageous for families and first-time buyers.
Neighborhoods
Both Washington DC and Worcester boast a wide range of neighborhoods that can cater to different preferences. From the bustling energy of Capitol Hill in DC to the historic charm of Worcester's Shrewsbury Street, there's sure to be a neighborhood that feels like home.
Houses and residents
Type
Washington
Worcester
Houses
357,482
82,375
Average household size (people)
2.1
2.5
Median year apartment built
1965
1960
Median year house/condo built
1941
1952
Length of stay in the house since moving in
13.5 years
15.8 years
Houses occupied
319,565 (89.4%)
76,065 (92.3%)
Houses occupied by owners
132,936 (41.6%)
32,714 (43%)
Houses occupied by renters
186,629 (58.4%)
43,351 (57%)
Median rent asked for vacant for-rent units
$2,791
$1,034
Median monthly housing costs
$1,817
$1,314
Median price asked for vacant for-sale houses and condos
$996,150
$425,443
Estimated median house or condo value
$669,900
$317,800
Median numbers of rooms
3.8
5.1
Median number of rooms in apartments
3.1
4.3
Median number of rooms in houses and condos
6
6.1
Median house price - detached houses
Over $1,000,000
$338,239
Median house price - in 2-unit structures
Over $1,000,000
$252,487
Median house price - in 3-to-4-unit structures
$471,443
$352,758
Median house price - in 5 or more unit structures
$527,983
$213,457
Median house price - Townhouses or other attached units
$817,288
$290,622
Median house price - All housing units
$790,542
$317,463
Median house age
65
67
Renting percentage
58%
55.5%
Housing density (houses/condos per square mile)
5,821.9
2,193.1
House value disparities
26.7%
25.3%
Household income disparities
45.7%
46.9%
Median household income for houses/condes with a mortgage
$163,111
$102,992
Median household income for apartments without a mortgage
$108,852
$78,632
Housing units without a mortgage
777 (0.8%)
687 (3%)
Housing units with both a second mortgage and home equity loan
8,586 (8.5%)
2,013 (8.8%)
Housing units with a mortgage
100,122 (99.2%)
22,130 (97%)
Housing units with a home equity loan
1,057 (1%)
289 (1.3%)
Housing units with a second mortgage
12,793 (12.7%)
2,828 (12.4%)
House/condo owner moved in on average (years ago)
10
15
House/condo renter moved in on average (years ago)
1
3
Housing units lacking complete kitchen facilities
1.5%
1.6%
Housing units lacking complete plumbing facilities
1.5%
1.1%
Housing units in structures
Housing units in structures
Washington
Worcester
One, detached
11.2%
32.1%
One, attached
22.2%
6.4%
Two
2.7%
7.9%
3 or 4
6.8%
25.1%
5 to 9
7.3%
8.6%
10 to 19
8.5%
5.4%
20 to 49
7.6%
4.4%
50 or more
33.6%
10.0%
Mobile homes
0.2%
0.1%
Median real estate property taxes paid for housing units
Self-employed workers in own not incorporated business
16,654
5,036
State government workers
6,699
5,706
Unpaid family workers
580
42
Industries and Occupations
Government, education, healthcare, and professional services dominate the industry landscape in Washington DC, while in Worcester, a more mixed economy prevails with health care, higher education, insurance, and manufacturing among the leading sectors.
When it comes to healthcare, both Washington, DC and Worcester, MA offer good access to well-rated hospitals and healthcare facilities. However, as both cities have a significant student population, there is a focus on accessible and affordable healthcare options.
Health (county statistics)
Type
Washington
Worcester
General health status score of residents in this county from 1 (poor) to 5 (excellent)
The infrastructure of Washington DC is well-developed with a strong public transit system. Worcester's infrastructure is smaller scale, which can be a plus for those not fond of crowded city life. Both cities continue to invest in infrastructure to support their residents and economy.
Infrastructure
Type
Washington
Worcester
Hospitals
114
14
TV stations
27
24
Arenas or stadiums
4
2
Bank branches located here
247
47
Bank institutions located here
34
12
Main business address for public companies
30
2
Drinking water stations with no reported violations in the past
5
0
Drinking water stations with reported violations in the past
HMDA - Conventional home purchase loans - Applications denied
Year
Washington
Worcester
1999
1,328
262
2000
1,438
328
2001
935
237
2002
886
312
2003
1,319
469
2004
2,281
822
2005
2,920
1,210
2006
3,362
1,134
2007
2,548
721
2008
1,095
375
2009
514
274
Culture and Food
Both cities boast a rich cultural scene, with DC offering numerous world-class museums and historic sites and Worcester featuring a booming arts scene and diverse dining options. The food scene in both cities is diverse with options from all over the world.
Sports Teams
As a larger city, Washington DC is home to professional teams in the major sports leagues (NFL, MLB, NBA, NHL), and seeing a game can be a major event. Worcester does not have major league teams, but sports fans can enjoy minor-league hockey and baseball games, and Boston's sports teams are only a short drive away.


 Washington, DC
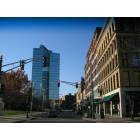
 Worcester, MA