Our analysis compares two distinct locations- Washington, DC, the nation's capital with a rich history and diverse culture, and Staten Island, New York's least populous borough with a suburban atmosphere. Though these cities share similarities, they are unique in their own ways regarding crime and safety, climate, cost of living, education, economy, infrastructure and more. Each city presents a unique lifestyle, opportunities, amenities, and challenges that can appeal to or deter different individuals based on their preferences and lifestyle choices.
In comparison to Staten Island, Washington, DC has a notably higher crime rate. Whereas Staten Island has a relatively low crime rate, especially compared to the broader New York City area. Therefore, from a safety perspective, Staten Island is generally safer. For tourists, both locations are safe to visit as tourism hotspots are generally well-patrolled, but caution should be exercised, as with any city.
Cost of Living
Washington, DC's cost of living is generally high, with housing being the largest expense. Staten Island, while less expensive than Manhattan or Brooklyn, is still significantly pricier than the national average. Both cities' high costs are influenced by their status as desirable, high-opportunity urban areas.
Income Tax
Washington, DC has a progressive income tax system, with rates ranging from 4% to 8.95%. New York also uses a progressive tax system, combined state and city taxes can range from 4% to 12.696% for Staten Island residents.
Property Tax
Property taxes in Washington, DC are relatively low compared to the New York region. Staten Island has the lowest property tax rate within the 5 boroughs of NYC, yet it has higher rates compared to DC.
Sales Tax
Washington, DC has a citywide sales tax of 6%, whereas New York City, including Staten Island, has a sales tax of 8.875% when combining state and city taxes.
Income
Type
Washington
Staten Island
Estimated median household income
$90,088
$86,054
Estimated per capita income
$65,808
$38,678
Cost of living index (U.S. average is 100)
124.2
164.1
If you make $50,000 in Washington, you will have to make $66,063 in Staten Island to maintain the same standard of living.
Geographical Conditions
Washington, DC is located along the east coast with a relatively flat geography. Staten Island is one of the five boroughs of New York City, located in the southwest part of the city. It is characterized by more hills and is surrounded by water.
Geographical information
Type
Washington
Staten Island
Land area
61.4 sq. miles
58.5 sq. miles
Population density
10,912 people per sq. mile
8,225.7 people per sq. mile
Relative area comparison
Washington, DC Staten Island, NY
Education
Both Washington, DC and Staten Island boast robust educational environments. Washington, DC is home to prestigious institutions like Georgetown and Howard Universities. Staten Island has few colleges, but being part of the New York City system means easy access to schools like NYU and Columbia. Both cities have a mix of public, private, and charter schools with diverse and numerous opportunities for K-12 education.
The economy of Washington, DC is robust and diverse, with strengths in sectors including government, education, and health care. Staten Island's economy, while smaller, features a mix of small businesses, retail, health care, and manufacturing jobs. Unemployment rates in both cities are usually relatively on par with the national average.
Biggest Employers
The federal government is, unsurprisingly, the biggest employer in Washington, DC. Staten Island's largest employers are in the healthcare and public sector, namely Staten Island University Hospital and the City of New York.
In Washington (District of Columbia), 90.9% voted for Democrats and 7.3% for Republicans in 2012 Presidential Election. In Staten Island (Richmond County), 50.8% voted for Democrats and 48.3% for Republicans.
Elections
Type
Democrats
Republicans
Other
Year
Washington
Staten Island
Washington
Staten Island
Washington
Staten Island
2020
92.6%
42.2%
5.4%
57.1%
2.0%
0.7%
2016
90.9%
41.0%
4.1%
56.1%
5.0%
2.9%
2012
90.9%
50.8%
7.3%
48.3%
1.8%
0.9%
2008
92.5%
47.8%
6.5%
51.9%
1.0%
0.4%
2004
89.6%
42.8%
9.4%
56.5%
1.0%
0.7%
2000
85.2%
52.1%
9.0%
45.1%
5.9%
2.9%
1996
85.2%
50.5%
9.3%
40.8%
5.5%
8.7%
Breakdown of population affiliated with a religious congregation
Type
Adherents
Congregations
Religion
Washington
Staten Island
Washington
Staten Island
CATHOLIC CHURCH
12.6%
54.2%
7.4%
20.6%
AMERICAN BAPTIST CHURCHES IN THE USA
6.2%
0.6%
10.3%
1.0%
SOUTHERN BAPTIST CONVENTION
4.4%
0.2%
10.3%
3.5%
EPISCOPAL CHURCH
3.1%
0.4%
5.3%
5.0%
SEVENTH DAY ADVENTIST CHURCH
0.9%
0.1%
1.8%
2.5%
MUSLIM ESTIMATE
0.7%
1.7%
1.1%
3.0%
EVANGELICAL LUTHERAN CHURCH IN AMERICA
0.5%
0.6%
2.1%
4.0%
Weather
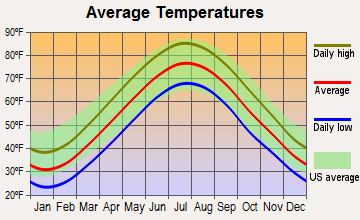
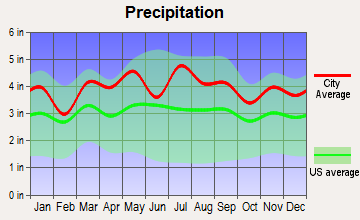
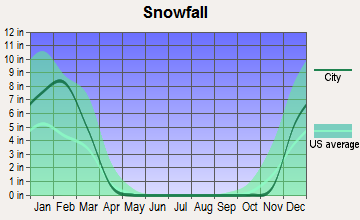
Washington, DC has a humid subtropical climate with hot summers and cold winters. On the other hand, Staten Island experiences a humid subtropical climate with similar summer temperatures but usually harsher winters due to its proximity to open water. Both cities receive moderate to high rainfall throughout the year.
Weather and climate
Type
Washington
Staten Island
Temperature - Average
56.4°F
54.1°F
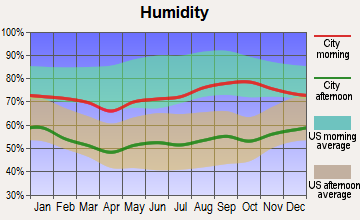
Humidity - Average morning or afternoon humidity
68.8%
67.4%
Humidity - Differences between morning and afternoon humidity
33%
29.9%
Humidity - Maximum monthly morning or afternoon humidity
81%
77%
Humidity - Minimum monthly morning or afternoon humidity
48%
47.2%
Precipitation - Yearly average
42.7 in
47.4 in
Snowfall - Yearly average
32.4 in
60 in
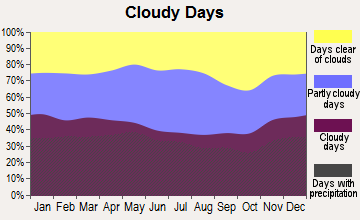
Clouds - Number of days clear of clouds
15.9%
15.8%
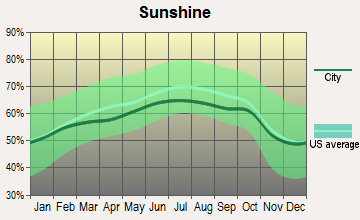
Sunshine amount - Average
61.5%
60.2%
Sunshine amount - Differences during a year
21%
20%
Sunshine amount - Maximum monthly
66%
64%
Sunshine amount - Minimum monthly
45%
44%
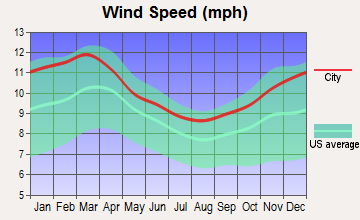
Wind speed - Average
9.7 mph
10.5 mph
Average climate in Washington, District of Columbia
Average climate in Staten Island, New York
Air pollution
Type
AQI
CO
NO2
OZONE
PB
PM10
PM25
SO2
Year
Washington
Staten Island
Washington
Staten Island
Washington
Staten Island
Washington
Staten Island
Washington
Staten Island
Washington
Staten Island
Washington
Staten Island
Washington
Staten Island
2018
88
94
0.32
0.35
11.6
17.1
23.2
24.1
N/A
N/A
16.4
N/A
8.8
7.9
0.8
0.4
2017
84
98
0.32
0.32
12.3
17.0
24.9
27.0
N/A
N/A
16.5
N/A
9.8
7.6
1.0
0.2
2016
98
94
0.43
0.37
14.7
17.9
24.6
28.5
0.002
N/A
17.2
N/A
9.5
7.7
1.0
0.2
2015
91
102
0.34
0.39
14.8
18.9
26.2
27.3
0.002
N/A
17.0
N/A
10.4
8.6
1.3
0.4
2014
85
97
0.33
0.38
11.6
19.2
25.9
25.6
0.002
N/A
17.1
N/A
10.0
8.3
1.0
0.7
2013
88
99
0.34
0.39
11.7
19.6
25.6
27.8
0.002
N/A
17.3
N/A
11.6
8.5
1.0
0.8
2012
103
102
0.58
0.42
15.2
19.3
27.6
26.9
0.002
N/A
N/A
N/A
12.2
9.2
1.6
1.4
2011
105
108
0.67
0.42
15.4
21.4
27.7
28.1
0.002
N/A
N/A
N/A
11.4
10.2
3.1
2.0
2010
114
114
0.88
0.40
15.9
19.9
29.3
28.7
0.003
N/A
N/A
N/A
9.3
9.4
3.4
1.8
2009
90
105
0.86
0.39
16.2
22.5
24.4
25.3
0.002
N/A
N/A
N/A
7.6
9.5
4.6
2.4
2008
103
111
1.23
0.39
16.2
23.0
25.3
24.3
0.003
0.013
N/A
N/A
8.5
11.3
5.6
3.4
2007
113
123
1.17
0.44
16.8
24.2
27.1
23.3
0.004
0.016
N/A
N/A
10.4
12.0
5.1
4.3
2006
114
117
1.11
0.55
17.2
25.6
25.5
24.7
0.004
0.018
N/A
N/A
10.9
13.1
4.5
5.3
2005
105
112
0.86
0.69
20.5
27.3
22.7
23.3
0.006
N/A
N/A
N/A
11.7
N/A
4.5
7.3
2004
113
109
0.62
0.68
21.3
26.4
20.6
22.2
0.004
0.030
N/A
N/A
11.3
N/A
6.5
6.9
2003
108
112
0.90
0.76
23.6
28.0
20.8
22.1
N/A
0.006
N/A
26.9
12.2
N/A
8.3
7.1
2002
125
125
1.16
0.74
23.7
30.6
25.0
24.7
N/A
0.008
N/A
26.1
N/A
N/A
6.7
6.6
2001
113
124
1.07
0.81
23.9
32.4
22.0
24.9
0.017
0.020
N/A
26.9
N/A
N/A
6.7
7.2
2000
115
116
1.17
0.93
20.2
33.0
19.1
23.1
N/A
0.022
N/A
22.2
N/A
N/A
8.2
7.2
Natural disasters
Type
Washington
Staten Island
Tornado activity compared to U.S. average
110.6%
61.3%
Earthquake activity compared to U.S. average
42.9%
31.2%
Natural disasters compared to U.S. average
19%
19%
Transportation
Washington, DC has a comprehensive public transportation network, whereas Staten Island relies heavily on cars and buses. Both cities experience significant commute times, with many Staten Islanders commuting to Manhattan for work, a journey that can easily take over an hour.
Transport
Type
Washington
Staten Island
Amtrak stations
1
0
Amtrak stations nearby
3
3
FAA registered aircraft
456
39
FAA registered aircraft manufacturers and dealers
3
2
Means of transportation to work
Type
Washington
Staten Island
Bicycle
2%
0.2%
Bus
6.3%
19.2%
Carpooled
7.8%
12.1%
Car alone
62.5%
54.3%
Ferryboat
0%
5.3%
Railroad
0.3%
0.9%
Streetcar
10.6%
0%
Subway
1.3%
2.6%
Taxicab
0.8%
0.4%
Walked
5.7%
2.9%
Average travel time to work
Type
Washington
Staten Island
Average
39.2 min
45.3 min
Real Estate
Washington, DC's real estate market is competitive with high home prices and rent. Staten Island tends to be cheaper than Manhattan, but still offers high property values due to its geographic location within New York City.
Neighborhoods
DC offers a diverse range of neighborhoods, from the historic charm of Georgetown to the vibrant nightlife in Adams Morgan. Staten Island is more suburban, with areas like St. George offering urban amenities and other parts of the Island offering a more tranquil suburban charm.
Houses and residents
Type
Washington
Staten Island
Houses
357,482
163,993
Average household size (people)
2.1
2.8
Houses occupied
319,565 (89.4%)
156,341 (95.3%)
Houses occupied by owners
132,936 (41.6%)
99,732 (63.8%)
Houses occupied by renters
186,629 (58.4%)
56,609 (36.2%)
Median rent asked for vacant for-rent units
$2,791
$1,320
Median price asked for vacant for-sale houses and condos
$996,150
$369,853
Estimated median house or condo value
$669,900
$605,500
Median number of rooms in apartments
3.1
3.9
Median number of rooms in houses and condos
6
6.1
Renting percentage
58%
35.9%
Housing density (houses/condos per square mile)
5,821.9
2,804.3
Household income disparities
45.7%
43.8%
Housing units without a mortgage
777 (0.8%)
19,289 (25%)
Housing units with both a second mortgage and home equity loan
8,586 (8.5%)
160 (0.2%)
Housing units with a mortgage
100,122 (99.2%)
57,986 (75%)
Housing units with a home equity loan
1,057 (1%)
5,623 (7.3%)
Housing units with a second mortgage
12,793 (12.7%)
4,499 (5.8%)
Housing units lacking complete kitchen facilities
1.5%
0.6%
Housing units lacking complete plumbing facilities
Self-employed workers in own not incorporated business
16,654
7,611
State government workers
6,699
6,285
Unpaid family workers
580
394
Industries and Occupations
In DC, government, professional services, and education are the prevailing sectors. In Staten Island, healthcare and social assistance, retail trade, and education services are the top industries. However, many residents commute to Manhattan for work in various other industries.
Both Washington, DC and Staten Island offer high-quality health care options. Washington, DC has highly regarded hospitals, including Georgetown University Hospital and George Washington University Hospital. Staten Island University Hospital serves the Staten Island community and is one of the region's leading healthcare providers.
DC's infrastructure is highly developed, given its status as the nation's capital, featuring vast public transit systems, highways, and airports. Conversely, Staten Island lacks an extensive public transit system, but it boasts well-maintained roads and bridges, and it stands out with its famous Staten Island Ferry.
Infrastructure
Type
Washington
Staten Island
Hospitals
114
25
TV stations
27
30
Bank branches located here
247
104
Bank institutions located here
34
19
Main business address for public companies
30
1
Drinking water stations with no reported violations in the past
5
1
Drinking water stations with reported violations in the past
10
3
Schools
School facilities
Type
Washington
Staten Island
Private elementary/middle schools
34
22
Private high schools
24
13
Public elementary/middle schools
157
63
Public high schools
44
16
Colleges/Universities
25
5
Culture and Food
Both cities have a rich cultural life. DC is known for its museums, performing arts scenes, and international cuisine. Staten Island offers a blend of suburban and urban cultures with a diverse food scene, including the legendary Staten Island pizza.
Sports Teams
Washington, DC is home to numerous professional sports teams, including the Washington Nationals (MLB), Washington Capitals (NHL), and the Washington Wizards (NBA). While Staten Island has no major league teams, the New York Yankees baseball team has a minor league affiliate based on the Island. Staten Island residents also have easy access to all New York City sports teams.


 Washington, DC
 Staten Island, NY